"No warning can save people determined to grow suddenly rich" - Lord Overstone
 |
Gold •752 days | 2,368.70 | +35.30 | +1.51% |
 |
Platinum •10 mins | 1,604.10 | -4.70 | -0.29% |
|
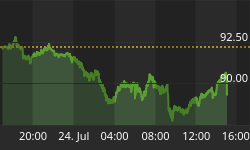
WTI Crude •1 day | 89.31 | -2.88 | -3.12% |
|
Gasoline •1 day | 3.396 | -0.101 | -2.87% |
|
Ethanol •752 days | 2.161 | +0.000 | +0.00% |
|
Silver •752 days | 30.82 | +1.16 | +3.92% |
 |
Silver • 752 days | 30.82 | +1.16 | +3.92% | |
|
Copper • 752 days | 4.530 | +0.111 | +2.51% | |
|
Brent Crude • 1 day | 96.78 | -3.91 | -3.88% | |
|
Natural Gas • 1 day | 2.871 | -0.045 | -1.54% | |
|
Heating Oil • 1 day | 4.181 | -0.161 | -3.71% |
Arthur Eckert

Contributor since: 26 Feb 2010
Biography
Arthur Albert Eckart is the founder and owner of PeakTrader. Arthur has worked for commercial banks, e.g. Wells Fargo, Banc One, and First Commerce Technologies, during the 1980s and 1990s. He has also worked for Janus Funds from 1999-00. Arthur Eckart has a BA & MA in Economics from the University of Colorado. He has worked on options portfolio optimization since 1998.
-
VIX 21-Day MA
The first chart is a two-year daily chart of SPX to VIX ratio (dots and right scale) with its 50-day MA (blue line) and SPX…
-
Estimated OLS of SPX to VIX
Below is a daily SPX to VIX chart (black dots) with SPX (green line) and VIX (below price chart), since 1990. The gray line is…
-
Intermediate-Term Market Downtrend
Much of the rally in September and October may be the result of end-of-fiscal-year window dressing. It seems, many financial institutions were caught-off guard by…
-
Potential Nasdaq Double-Top
Below is a Nasdaq weekly chart (candlesticks and right scale) with SPX (blue line and left scale). In May, Nasdaq topped at 2,378. Last week,…
-
SPX: Compressing Between Resistance & Support
On Wednesday, SPX opened sharply higher on the better than expected CPI report, although the core rate was in-line. SPX reached about 1,373 before pulling-back…
-
Overextended Market
The first chart is an SPX monthly chart that shows it's rare when both RSI and ULT (Ultimate Oscillator) are above 70. Also, SPX closed…
-
Market Forecast
Over the past several months, there has been rotation from cyclical to non-cyclical stocks, which suggests the cyclical bull market is in a late stage.…
Sign up to the
Safehaven Market Insider


