"No warning can save people determined to grow suddenly rich" - Lord Overstone
 |
Gold •747 days | 2,368.70 | +35.30 | +1.51% |
|
Platinum •10 mins | 1,629.30 | +25.30 | +1.58% |
|
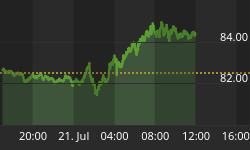
WTI Crude •11 mins | 84.36 | +1.88 | +2.28% |
|
Gasoline •11 mins | 3.392 | +0.003 | +0.09% |
|
Ethanol •747 days | 2.161 | +0.000 | +0.00% |
|
Silver •747 days | 30.82 | +1.16 | +3.92% |
 |
Silver • 747 days | 30.82 | +1.16 | +3.92% | |
|
Copper • 747 days | 4.530 | +0.111 | +2.51% | |
|
Brent Crude • 11 mins | 91.21 | +1.99 | +2.23% | |
|
Natural Gas • 11 mins | 2.857 | -0.003 | -0.10% | |
|
Heating Oil • 11 mins | 4.090 | -0.029 | -0.71% |
Guy Lerner

Contributor since: 20 May 2013
Biography
Guy M. Lerner, MD has been writing about the markets for over 10 years providing readers with independent and original market analysis.
-
The Sentimeter: 7.21.13
Our neutral market reading in The Sentimeter has morphed into an optimistic reading. There are lots of bulls, and surprisingly, at this stage of the…
-
The Sentimeter: 7.14.13
For the fifth week in a row, equity market investor sentiment remains neutral. Over the past 3 weeks, the market erased the losses suffered over…
-
Video of the Week: Man Has Got To Know His Limitations
This week's Chart of the Week video looks at a unique indicator: the Rydex Bullish and Leveraged to Bearish and Leveraged Ratio. The Rydex asset…
-
Video of the Week: SPY and TLT - A Simple Trend Line Approach
This week's Chart of the Week video looks at the S&P Depository Receipts (symbol: SPY) and the i-Shares 20 + Year Treasury Bond ETF (symbol:…
-
The Sentimeter: 7.7.13
For the fourth week in a row, equity market investor sentiment remains neutral. Six week's ago it was extremely optimistic and just like that with…
-
Chart of the Week Video: "What Should We Be Afraid Of?"
This week's Chart of the Week video looks at yields on the 10 year Treasury Bond (symbol: $TNX.X), and asks: "What should we be afraid…
-
Webinar Snippet: Base Metals
In this Webinar Snippet, we discuss the bear market dynamics in copper, FXI, and XME. TacticalBeta offers a 21 day FREE TRIAL (no credit…
-
Webinar Snippet: Precious Metals
In this Webinar Snippet, we discuss the bear market dynamics in gold and silver.
-
The Sentimeter: 6.23.13
For the second week in a row, equity market investor sentiment remains neutral. Four week's ago it was extremely optimistic and just like that with…
-
Chart of the Week Video: 'Plain and Simple Mr. Hilsenrath'
This week's Chart of the Week video looks at the stock market's reaction to this past week's FOMC announcement. So let's get technical!
-
Relative Strength Indicator: Remains in Danger Zone
Figure 1 is a weekly chart of the SP500. The indicator in the lower panel is a composite that looks at the relative strength of…
-
The Sentimeter: 6.16.13
Equity market investor sentiment is now neutral. Three week's ago it was extremely optimistic and just like that with everyone all in, the market struggles.…
-
Real Time Recession Indicator: 6.10.13
Our real time recession indicator is constructed from various leading economic indicators and two pricing models. The indicator continues to show that the US economy…
-
The Sentimeter: 6.2.13
Equity market investor sentiment has turned optimistic after last week's "extreme optimism" reading as the extremes in selling have slowed amongst the "smart money". They…
-
Chart of the Week Video: Dents in the Armor
This week's Chart of the Week video looks at the dings and dents in the market's armor, and I wonder when will the US equity…
-
The Sentimeter: 5.26.13
Equity market investor sentiment remains extremely optimistic. In fact, sentiment became more bullishly extreme despite the drop in prices week over week. See the Equity…
-
Chart of the Week Video: Parabolic Thinking!
This week's Chart of the Week video looks at the notion that bean stalks don't grow forever, stock prices don't always go up, and investors…
-
The Sentimeter
Equity market investor sentiment has turned extremely optimistic. See the Equity Market Investor Sentimeter below, which is our most comprehensive sentiment indicator. This indicator is…
-
TIPS=TOP
This week's Chart of the Week video looks at the i-Shares Barclays TIPS Bond Fund ETF (symbol:TIP). This normally low risk investment has sold off…
Sign up to the
Safehaven Market Insider


