 |
Gold •583 days | 2,368.70 | +35.30 | +1.51% |
 |
Platinum •10 mins | 2,099.40 | +28.80 | +1.39% |
 |
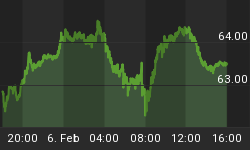
WTI Crude •18 hours | 63.55 | +0.26 | +0.41% |
 |
Gasoline •18 hours | 1.953 | +0.027 | +1.38% |
 |
Ethanol •583 days | 2.161 | +0.000 | +0.00% |
 |
Silver •583 days | 30.82 | +1.16 | +3.92% |
 |
Silver • 583 days | 30.82 | +1.16 | +3.92% | |
 |
Copper • 583 days | 4.530 | +0.111 | +2.51% | |
 |
Brent Crude • 17 hours | 68.05 | +0.50 | +0.74% | |
 |
Natural Gas • 18 hours | 3.422 | -0.087 | -2.48% | |
 |
Heating Oil • 18 hours | 2.413 | +0.020 | +0.84% |

Trading On The Mark
Contributor since: 20 Aug 2012
Biography
Our work is grounded in several technical methods. We make use of Elliott Wave, Gann techniques, Fibonacci relationships in price and time, cycles, and other approaches. Most members have several years or decades of trading experience, but we also provide an environment where the dedicated newer trader can learn much that is not available in published books or found in courses.
-
Two Upward Paths for the U.S. Dollar
Our mid-February post presented a modestly bullish forecast for gold prices in 2017. Meanwhile, our two leading scenarios for the U.S. Dollar Index show why…
-
Gold Charts an Upward Path into Summer
After a rally last year that exceeded our expectations, the second half of 2016 saw gold prices decline to test the target region we had…
-
A Modestly Bullish Path for Silver
Last month, we posted charts that showed a bullish scenario for gold. In that view, precious metals should make a low sometime near or after…
-
The Very Bullish Case For Gold
For several months, we have been suggesting to readers that they should view gold as a long-term value buy. The strong rally in February helped…
-
Gold and Silver Index Can Still Go Lower
While we believe precious metals are trying to establish an important low nearby, we acknowledge that the chart patterns for gold and silver futures have…
-
Gann Targets and Geometry Map - The Next Silver Trade
Silver futures appear to have made an important low and are now rallying. However, we believe the best way for traders to take advantage of…
-
With Gold the Friendliest Trend is Sideways
For gold traders, the trend is likely to be a fickle friend during the next year and possibly longer. Consider developing a relationship with volatility…
-
Crude Oil Prices Probably Made a Low
A potentially completed Elliott wave count on the crude oil futures charts suggests that traders will benefit from having a bullish bias during the next…
-
Choppy Upward Move in Bonds Until December
Chart patterns for U.S. Treasury bonds suggest that the market may need one more high later this year before it makes a reversal. For those…
-
Upward Reversal Still Likely for Gold
One of the important tools in the technical analyst's kit consists of a simple question: "How can the market get the greatest number of traders…
-
Stock Markets Waiting for Next Triggering Event
With several U.S. and European stock indices tracing potential topping patterns, a jolt to the markets this week could lock in a market top. The…
-
The Next Move in Bonds has Big Implications
This is a follow-up to our February post in which we identified the conditions for treasury bond prices to decline into support and treasury yields…
-
Crude Oil Rally May Be Nearly Over
Even though crude oil prices have moved lower than most traders expected (and we admit it -- lower than we expected!) there are signs that…
-
Looking up for Silver
We still favor higher during the next two months for precious metals, although we acknowledge that the choppy action of recent months has made the…
-
Russell Best Candidate to Make Lower High
One thing traders can expect reliably from topping events in stock indices is that they will be complicated. In that respect they are unlike the…
-
Gold Poised to Rally Into Summer
This update follows our October 2014 and January 2015 posts about gold and silver respectively, in which we wrote that traders should expect precious metals…
-
More Than a Correction in The NASDAQ 100?
When the market closed on Thursday of this week, it left most U.S. equity indices near the middle of this year's range without an obvious…
-
A Trader's Advantage in Silver
A steeply rising U.S. Dollar along with falling prices for certain major commodities have kept pressure on precious metals for several months. At the same…
-
German DAX Might Lead in The Next Big Trend
Despite impressive rallies during the first part of 2015, many of the world's most heavily traded stock indices are showing signs of pattern completion and…
-
Look For Gold Rally to Resume
In late October, we alerted readers at SafeHaven that an important price low was imminent for gold. Our more recent post about silver prices explained…


