


The broad stock market reached its new record high yesterday, as the S&P 500 index extended the short-term uptrend above 2,900 mark fueled by the big cap tech stocks' rally. Will this run-up continue towards the level of 3,000 or higher?
The U.S. stock market indexes gained between 0.2 percent and 1.0 percent on Wednesday, as investors reacted to better-than-expected economic data releases. The S&P 500 index has reached yet another new record high at the level of 2,916.50. The Dow Jones Industrial Average gained just 0.2 percent and the technology Nasdaq Composite gained 1.0 percent yesterday.
The nearest important level of support of the S&P 500 index is now at around 2,900, marked by the previous short-term resistance level. The next support level is at 2,875-2,885, marked by Monday's daily gap up of 2,876.16-2,884.69. The support level is also at 2,860-2,865., On the other hand, potential resistance level is at 2,950-3,000.
The broad stock market reached another new record high yesterday, as it extended its short-term uptrend above the level of 2,900. We may see more upward price action in the near term, but some downward correction may be coming. The market has retraced its late January - early February downward correction recently. So will it continue towards 3,000 mark? The index trades above its medium-term upward trend line, as we can see on the daily chart:

(Click to enlarge)
Downward Correction?
Expectations before the opening of today's trading session are slightly negative, because the index futures trade 0.2 percent below their Wednesday's closing prices. The European stock market indexes have lost 0.2-0.6 percent so far. Investors will wait for some economic data announcements today: Personal Spending, Personal Income, Initial Claims at 8:30 a.m. The broad stock market will probably open slightly lower today. We may see some short-term downward correction following the recent rally. There have been no confirmed negative signals so far. However, we can see technical overbought conditions. Related: Floods Could Cut Indian Gold Demand In Half
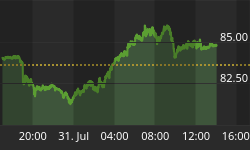
The S&P 500 futures contract trades within an intraday downtrend, as it retraces some of its yesterday's rally. The nearest important level of resistance is at around 2,910-2,915, marked by the new record high. On the other hand, support level is at 2,895-2,900, among others. The futures contract trades above its few-day-long upward trend line, as we can see on the 15-minute chart:

(Click to enlarge)
Nasdaq Close to New Record High
The technology Nasdaq 100 futures contract follows a similar path, as it retraces some of its recent advance. The nearest important resistance level is at around 7,675-7,700, marked by the new record high. On the other hand, the support level is at 7,600, marked by the recent level of resistance. The Nasdaq futures contract accelerated its short-term uptrend yesterday, as the 15-minute chart shows:

(Click to enlarge)
Apple, Amazon Rally to New Records
Let's take a look at Apple, Inc. stock (AAPL) daily chart (chart courtesy of http://stockcharts.com). It reached the new record high yesterday at the level of $223.49. There have been no confirmed negative signals so far. However, we may see a downward correction at some point. The nearest important level of support is now at $205-210, marked by the recent consolidation. The price is still at its short-term upward trend line:

(Click to enlarge)
Now let's take a look at Amazon.com, Inc. stock (AMZN) daily chart. It has reached the new record high at the price of $1,998.69 yesterday.
Related: Is This What Has Kept Gold Prices Low?
The stock accelerated its uptrend above its month-long upward trend line. We can see some negative technical divergences. However, there have been no confirmed negative signals so far:

(Click to enlarge)
Dow Jones Relatively Weaker
The Dow Jones Industrial Average reaches new local highs after breaking above its last week's high. The blue-chip stocks' gauge remains above the level of 26,000. But it continues to trade below its late January record high of 26,616.71. The nearest important level of resistance is at 26,340-26,440, marked by the late January daily gap down. The index remains above its two-month long upward trend line, as the daily chart shows:

(Click to enlarge)
The S&P 500 index reached the new record high at the level of 2,916.50 yesterday. Will the uptrend continue towards 3,000 mark? There have been no confirmed negative signals so far. However, we can see some short-term overbought conditions along with negative technical divergences.
Concluding, the S&P 500 index will likely open slightly lower today. The market accelerated its uptrend, and we may see some short-term profit-taking action following the recent rally.
By Paul Rejczak via Sunshine Profits
More Top Reads From Safehaven.com


