"No warning can save people determined to grow suddenly rich" - Lord Overstone
 |
Gold •724 days | 2,368.70 | +35.30 | +1.51% |
|
Platinum •15 mins | 1,647.30 | +28.50 | +1.76% |
 |
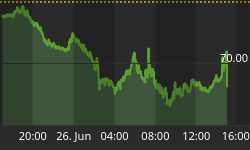
WTI Crude •1 day | 69.23 | -2.69 | -3.74% |
|
Gasoline •1 day | 2.957 | -0.070 | -2.32% |
|
Ethanol •724 days | 2.161 | +0.000 | +0.00% |
|
Silver •724 days | 30.82 | +1.16 | +3.92% |
 |
Silver • 724 days | 30.82 | +1.16 | +3.92% | |
|
Copper • 724 days | 4.530 | +0.111 | +2.51% | |
|
Brent Crude • 1 day | 71.99 | -3.27 | -4.34% | |
|
Natural Gas • 1 day | 3.279 | -0.016 | -0.49% | |
|
Heating Oil • 1 day | 3.208 | -0.090 | -2.73% |
Markets

Don't Fight Central Banks, But Be Afraid
There May Be Gains To Capture In Stocks In The Coming Years, But Risk Management May Be Very Important Down The Road ...
Sales, Earning Estimates Contract First Time Since 2009; US Back in Recession?
Large US corporations posted their first decline in both earnings and sales since the great recession. Are we back in recession?
Precious Metals Starting To Produce Some Winners
Everybody who's owned gold and silver mining shares through a couple of cycles has their favorite story of the stock that took off and ran away. There was Glamis Gold,…
The Global Depression and Deflation Is Currently Underway!
Most central bank policy makers, investors, and analysts around the world today are gripped by the worry of declining growth rates, dwindling international commodity prices, high unemployment, and other macroeconomic…
Fed Set to Spook the Markets Once Again!
The charts below show that the recent rally is just fodder for the beast. Prior to the last FED meeting on September 17, I warned of an impending sell-off due…
Big News This Week on the Fed, Debt Ceiling, and Physical Silver Premiums
Gold and silver spot prices lost ground to a strengthening U.S. dollar last week. The dollar enjoyed its best week in 5 months, as other major world currencies weakened. European…
It Just Doesn't Matter
So you think the economy is going into recession, or is already there. For growing numbers this is true if you are not part of the subsidized and / or…
Gold and Silver Update
As expected Gold has been breaking out of its triangle formation and quickly pushed higher. So far $1,191 has been the high of this move - still way below my…
Weekend Report...US Stock Bull Snorthing
Another big reason I've remained bullish on the stock markets is the monthly chart for the INDU, The Jaws of Life, chart. I know a lot of folks have given…
USDCHF: Triangle Pointing To The Upside; Bullish Momentum Could Follow
USDCHF has been moving sideways since end of March. We see five price swings between two trendlines that reminds us on a triangle formation. That's a five wave A-B-C-D-E pattern…
Sign up to the
Safehaven Market Insider


