


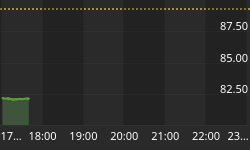


Gold has been holding the $1,300 level for almost a week now. While that handle remains an important psychological level, any further deterioration is likely to trigger a bigger slide.
Specifically, Louise Yamada, MD at Louise Yamada Technical Research Advisors, says that if the uptrend is broken, gold prices could tumble as low as $1,250 before finding the next support level.
Gold prices haven’t plunged that low in 2018, with December being they last time they did so. Current price of $1,302 per ounce is about 4 percent above that level.

(Click to enlarge)
Source: CNBC
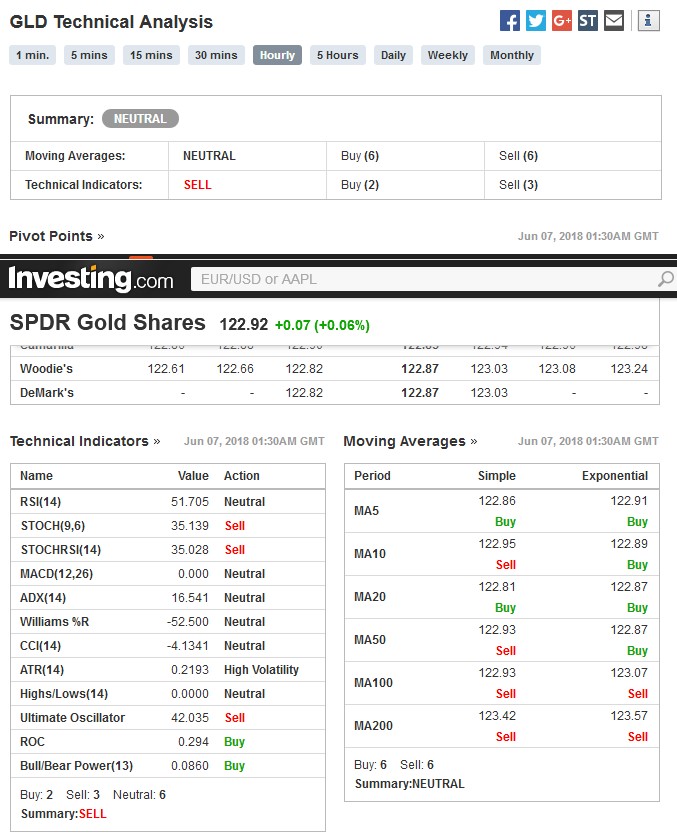
Yamada's analysis is based on a number of technical signals that point to a potential breakdown in price. Among them: gold prices have fallen below the 50-day and 200-day moving averages, with both trend lines either flattening or falling--a bearish signal.
Further, momentum levels suggest downward pressure on prices.
Weekly momentum is currently on ‘Sell’ based on the MACD (Moving Average Convergence Divergence) while monthly momentum is also approaching a Sell level.
Recent upward bursts have failed to materialize into any significant long-term rallies, breaking down at the $1,365 level in 2016, 2017 and again in 2018.
Gold has been long-term bearish ever since prices plunged 45 percent in 2011, and the current price is almost breaching the 2016 uptrend. Gold prices hit a 52-week high of $1,369 in January before quickly pulling back. Related: 5 Cool Ways Walmart Is Improving The Shopping Experience
Currently, short-term indicators including the 5-day, 10-day and 20-day moving averages are mostly flashing a buy signal, while long-term ones including 50-day, 100-day and 200-day moving averages are flashing red.
(Click to enlarge)
Source: Investing.com
Bullish Stock Markets Depressing Gold Prices
Yamada has cautioned that a healthy equities market is likely to continue depressing prices of the yellow metal due to the inverse relationship between the two. Gold prices tend to come down when stocks are moving up and vice-versa.
Which is hardly any consolation for gold bugs given how stocks markets have lately sprung back to life. Over the past 30 days, the broad-market S&P 500 is up 3.7 percent; the Dow Jones has gained 3.2 percent while the Nasdaq Composite has rallied 5.8 percent.
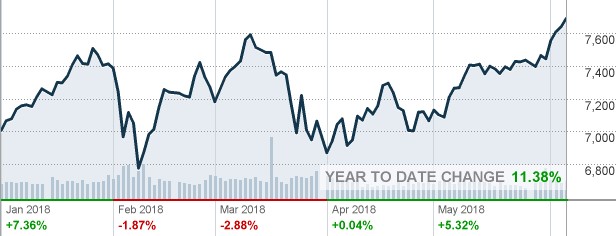
The Nasdaq Composite has been particularly impressive, closing Tuesday's trading at an all-time high of 7,689.24. The strong rally by the tech-heavy index is an indication that investors' confidence in the market is returning.
Nasdaq Composite (COMP) YTD Change
(Click to enlarge)
Source: CNN Money
Gold has lately been range-bound as the market focuses its attention on the upcoming FOMC meeting where the Fed is expected to announce a 0.25-percent hike in short-term Treasury rates. The June hike looks almost like a certainty after May's labor report easily surpassed expectations.
Related: Facebook’s War On Propaganda
Investors will be watching to see if the Fed will take a hawkish or dovish stance, with the former being more likely after the latest exploits in the labor market. That's bearish for gold.
Hope for Gold Bulls
The gold outlook is decidedly bearish at this point. However, there's still some hope for the bulls.
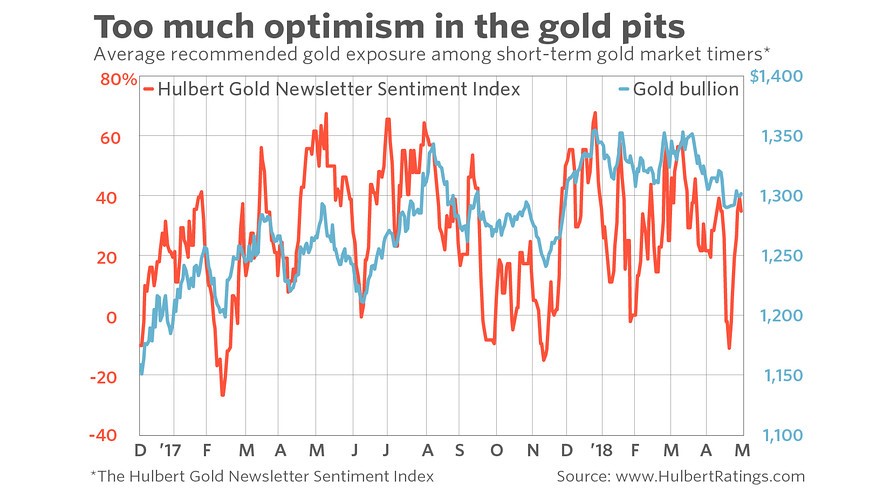
One little-known indicator suggests that gold investors are more bullish than bearish at this point. The Hulbert Gold Newsletter Sentiment Index, or HGNSI is a gold sentiment indicator comparable to CNN's Fear and Greed Indicator. HGNSI's latest reading suggests that there's still a lot of optimism in the gold market.
(Click to enlarge)
Source: Market Watch
This implies that any bullish event for gold is likely to lead to a nice rally for the yellow metal. Further, a big fall to around $1,250 is likely to eventually turn into a strong rally. So it looks like a win-win for bulls who know how to play their cards well.
By Alex Kimani for Safehaven.com
More Top Reads From Safehaven.com:


