The gold bear market shows no signs of relenting even as the yellow metal continues to defy bullish expectations fueled by trade wars and geopolitical tensions between the US and its trading partners.
Even more intriguing is the fact that the dreaded death cross recently appeared on gold’s technical charts portending an even deeper slide.
The death cross is a bearish crossover that in this case came after gold’s 50-day moving average of $1,306.26 an ounce moving below the longer-term 200-day moving average, currently at $1,307.20. Chart watchers believe that the death cross is the point at which a short-term downdraft morphs into a long-term decline.
That death cross is the first for the commodity since 2016.

(Click to enlarge)
Source: MarketWatch
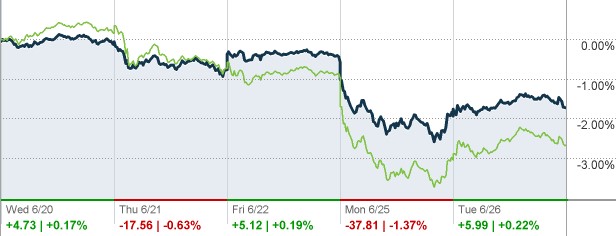
Even more vexing is the fact that the slump has continued despite weakness in leading equity benchmarks, again defying the common belief that gold is a good stock hedge. The S&P 500 has dipped 1.43 percent over the past five trading days, while the Dow Jones has tumbled 1.7 percent. The erstwhile high-flying tech-heavy Nasdaq Composite has been hardest hit after cratering 2.1 percent over the timeframe. Related: JPMorgan: Emerging Markets Heading Into Bear Territory
S&P 500 Index (SPX) vs. Nasdaq Composite Index (COMP) 5-Day Change.

(Click to enlarge)
Source: CNN Money
Dollar to Blame for Gold Selloff
So why does gold keep sliding even as risk sentiment keeps rising?
The US has renewed trade war threats with China and the European Union after president Trump threatened to slap a 25-percent tariff on all vehicle imports from the bloc. The EU is the biggest exporter of cars to the US. Under normal circumstances, a threat of that magnitude would have increased safe-haven demand and given a nice boost to the yellow metal.
Gold bulls can largely pin the blame for the selloff on the dollar, which has strengthened sharply against its major rivals in recent weeks.
US Dollar Index futures have advanced 6.3 percent over the past three months, effectively reversing early-year weakness as the Fed continues with plans to raise short-term bond rates—bullish for the greenback.
Meanwhile, the ICE U.S. Dollar Index has advanced 3 percent against a basket of half a dozen major world currencies in the year-to-date.

(Click to enlarge)
Source: Investing.com
The dollar has historically had an inverse relationship with gold, with the correlation becoming particularly pronounced in May just prior to the June Fed rate hike when the 20-day rolling correlation reached minus 0.88. A correlation of 1 means assets are moving perfectly in lockstep; minus 1 means they are moving in a perfectly inverse relationship while 0 means they are totally indifferent to each other.
The polarity of the pair can be understood in the context that a stronger dollar makes dollar-denominated assets more expensive to buyers using other currencies.
A Contrarian Position
While a death cross is certainly an ominous sign, it most certainly does not signal an automatic long-term bear market for gold. For one, the inverse correlation between gold and the dollar has weakened considerably since May, with the 20-day rolling correlation currently being a mere 0.08, which is as good as non-existent.
This effectively means that the greenback has lately lost a huge amount of its power over gold.
Related: Cheap Credit Could Lead To A New Economic Depression
Second, past death crosses in the gold market have not always resulted in prolonged bear markets. In fact, selling gold after a death cross has frequently been a losing strategy than a winning one in the current millennium.
Since 2001, there has been eight death crosses in the gold market out of which only three have resulted in long-term bear markets, with the others being good short-term buying opportunities. That’s the case mainly because the death cross is a lagging indicator that can appear well into a bear market.

(Click to enlarge)
Source: SunshineProfits
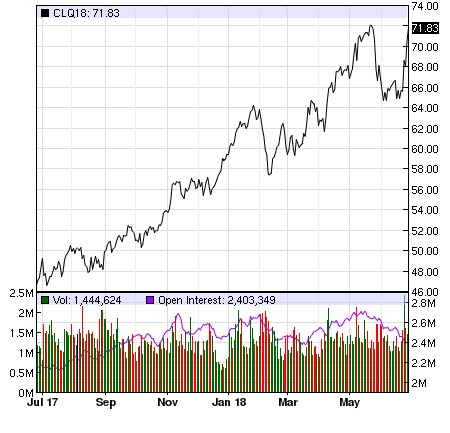
Finally, oil prices are on a nice uptrend…

(Click to enlarge)
Source: Nasdaq
Which could translate to a nice uptrend for gold too since gold and oil show strong positive correlation:

(Click to enlarge)
Source: GoldMoney
So maybe gold bulls ought to keep their shirts on.
By Alex Kimani for Safehaven.com
More Top Reads From Safehaven.com:
- Brexit’s $34 Trillion Problem
- Gold Remains Under Pressure
- Banks Are Spending Billions On Artificial Intelligence


