


Investors have pulled much capital out of gold in recent months in a major mass exodus. Their sentiment waxed very bearish as gold was pounded lower by extreme record gold-futures short selling. The latest record stock-market highs also suppressed the perceived need for diversifying portfolios with gold. But this heavy investment gold selling is slowing, and should reverse sharply once stock markets roll over again.
Not too long ago in mid-June, gold was trading at $1302. It looked fairly strong for the summer doldrums, its weakest time of the year seasonally. But selling would soon return with a vengeance, pummeling gold 9.9% lower over the next 2.1 months into mid-August. That major slide leading into a late-summer low of $1174 certainly cast a dark pall over psychology, fueling surging bearishness that remains ubiquitous today.
While investment selling wasn’t the primary driver, it ultimately contributed in a big way. This gold selloff that started normal before snowballing to anomalous proportions was initially sparked by a sharp rally in the US Dollar Index. It rocketed 1.3% higher in mid-June on a major European Central Bank decision. It announced it was finally ending its massive quantitative-easing campaign at year-end, as widely expected.
But the ever-cunning ECB officials led by Mario Draghi sought to soften that hawkish blow with a side promise not to hike rates “at least through the summer of 2019”. The euro plunged 1.8% on that, goosing the US dollar. American gold-futures speculators took note, as they often make trading decisions cueing off of short-term dollar action. So they sold aggressively overnight, hammering gold 1.7% lower the next day.
That startling drop kicked off a self-feeding chain reaction that cascaded for a couple months. Extreme short selling of gold futures by speculators forced gold lower. The weaker prices convinced these same traders to keep piling on more shorts, which pushed gold lower still. This vicious circle of leveraged short selling ultimately catapulted speculators’ total shorts to a series of new crazy-extreme all-time record highs.
All gold investors and speculators need to understand this dynamic, and I explored it in depth in an essay just a couple weeks ago. That wildly-unprecedented gold-futures shorting is the primary reason gold fell so sharply from mid-June to mid-August. But it had an unfortunate side effect of spooking investors, so they too soon started selling in sympathy. Those heavy investment outflows exacerbated gold’s decline.
The resulting gold selloff was very anomalous even for the summer doldrums. This first chart is updated from my early-June essay warning about these then-imminent summer doldrums. It reveals how gold has performed during the summers of every modern bull-market year, from 2001 to 2012 and 2016 to 2018. To keep differing price levels comparable, every year is individually indexed to 100 as of May’s final close.
With all gold action recast off that common base, this year’s huge divergence from norms is very evident. The yellow lines show individual-year indexed gold action, which tended to drift in a +/-5% range from the last pre-summer close. All those yellow lines are averaged together in the red line. That shows gold is usually weakest in June, recovers in July, and then starts powering higher in its strong seasonal autumn rally.
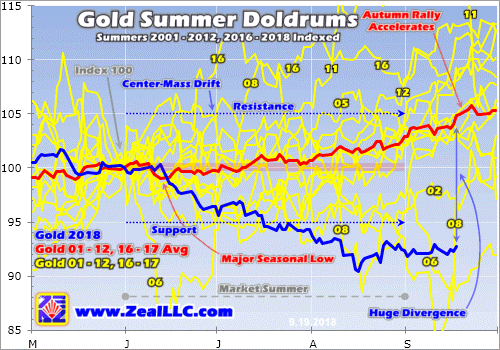
But that usual summer script sure didn’t play out this year! The gold action was sideways like usual into mid-June, but then deteriorated sharply. Thanks to the extreme record gold-futures shorting on that dollar rally along with the investment selling it spawned, gold plunged 3.5% in June. That was far worse than the 0.2% average slide in June in these modern bull-market years. That heavily tainted sentiment in gold-land.
As selling fueled even more selling gold fell another 2.3% in July, also way behind its typical 0.9% gain that month. And the carnage didn’t end in August despite gold carving a mid-month capitulation low as speculators’ epic record gold-futures-shorting binge climaxed. Gold shed another 2.0% last month, way behind its 2.2% average August gain. So summer 2018 challenged 2008’s for the worst of this modern era!
There are two key points here. First, this recent action was incredibly anomalous even by gold’s weak standards in the summer doldrums. It’s not often that gold-futures speculators short sell at extremes that history had never before shown were even possible. And to have that epic shorting orgy coincide with new stock-market record highs was rotten luck. The resulting investment selling was very abnormal too.
Second, this frenzy of heavy gold selling opened up a huge divergence between where gold is now and where it ought to be this time of the year. Normally gold’s major autumn rally is well underway by mid-September. The farther any market is dragged from norms by extreme unsustainable action, the greater the odds of an imminent mean reversion. Gold should surge fast as the recent wild selling inevitably reverses.
The primary driver of gold’s coming snap-back rally will be record gold-futures short-covering buying that is proportional to recent months’ record-extreme shorting. And investment buying will bolster and amplify that, just like investor selling did on the way down. The more gold rallies, the more investors are attracted to deploy capital back into it. The near-term upside alone is big given the huge seasonal divergence now.
Normally in bull-market years, gold is trading 4.9% above its final pre-summer close by this week. But this year it’s a whopping 7.3% under May’s exiting level now. To fully close this gap, gold would have to surge 13.1% higher from here to $1362! And the coming rally ought to unfold rapidly. Gold-futures short covering out of extremes can quickly mushroom into full-blown short squeezes due to futures’ extreme leverage.
Gold’s investment situation today isn’t as crazy as those epic record gold-futures shorts, but it is still way lower than normal and thus very bullish. This next chart looks at the physical gold bullion held in trust for investors in the leading and dominant GLD SPDR Gold Shares gold ETF. GLD’s holdings offer a unique high-resolution read on what’s going on with gold investment demand, as they are actually reported daily.
Most gold fundamental data is only available quarterly, or monthly at best. GLD’s holdings offer a near-real-time view of whether investors are buying or selling gold. It is the world’s largest gold ETF by far in terms of holdings, according to the World Gold Council. At the end of Q2’18, GLD’s 819.0 metric tons of gold were 3.0x larger than its next-biggest competitor’s. The largest foreign gold ETF in Germany only held 181.7t.
GLD’s mission is to track the gold price, but GLD shares’ supply and demand is independent from gold’s own. Thus GLD’s managers have to equalize excess GLD-share buying or selling pressure directly into physical gold itself or this ETF’s share price will decouple. So GLD effectively acts as a conduit for the vast pools of American stock-market capital to slosh into and out of gold. GLD’s changing holdings reflect this.
When investors are buying GLD shares faster than gold is being bought, the GLD-share price threatens to breakaway to the upside. GLD’s managers prevent this by issuing enough new GLD shares to satisfy the excess demand. Then they plow the resulting proceeds directly into gold bullion which boosts this ETF’s holdings. So rising GLD holdings mean investment capital is flowing into gold, which naturally bids it higher.
But the opposite happened in recent months as investors dumped GLD shares faster than gold was being sold. GLD’s share price would’ve failed to the downside if its managers hadn’t stepped in to sop up that excess supply. They raised the capital to buy back GLD shares by selling some of its gold bullion held in trust for shareholders. Thus falling GLD holdings reveal investment capital flowing out of gold, pushing it lower.
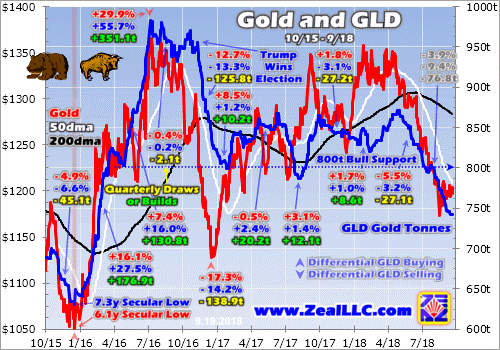
This chart divides GLD-holdings and gold-price action into calendar quarters. That happens to be very useful for fundamental analysis because the World Gold Council’s definitive reads on global gold supply and demand also cover calendar quarters. Called Gold Demand Trends, these excellent quarterly reports are essential reading for all gold investors. They help illuminate a great deal in the often-murky gold markets. Related: The New Ultra-Wealthy Benchmark Is $50 Million
Gold’s price change in each calendar quarter is noted above, along with both GLD holdings’ percentage and absolute-tonnage changes in these same spans. The latter are highlighted in green when they’re a build, showing stock-investor capital flowing into gold. Yellow shows draws, when investors are selling gold to pull capital out. GLD’s draws have been major recently as investors fled the record gold-futures shorting.
This summer’s gold-investment-selling story starts earlier though, back in mid-April. Gold was trading at $1352 then, right on the verge of a major bull-market breakout that would’ve unleashed much investment demand. But then a strong US Dollar Index short-squeeze rally erupted, propelling the dollar up sharply for about 6 weeks or so. That also motivated the gold-futures speculators to sell short, driving gold lower.
So after hitting a 10.0-month high of 865.9t in mid-April, the heavy differential GLD-share selling actually started in early May. By the end of May heading into the summer doldrums, GLD’s holdings were off 2.2% already to 847.0t. After another sharp drop in early June, they stabilized at 828.8t for a couple of weeks running. But as gold started falling on that extreme gold-futures short selling, investors worried.
There were 44 trading days between mid-June and mid-August where gold plunged 9.9%. During this span, GLD suffered 22 separate draw days averaging a substantial 0.4%! That compares to just 3 build days, so gold investment selling dominated. Overall GLD’s holdings fell 6.7% during that summer gold drop, this ETF forced to spew out 55.3t of physical gold bullion as investors fled gold with it spiraling lower.
And that heavy investment selling didn’t cease as gold bottomed near $1174 in mid-August. Investors kept on liquidating gold, dumping their GLD shares faster than gold itself was being sold. Short-term trends in gold investment demand are ignited and largely driven by the gold price action resulting from the gold-futures speculators’ leveraged trading. Investment-capital flows lag futures and take on a life of their own.
In financial markets, buying begets buying and selling begets selling. Most traders simply pile on existing trends, they aren’t contrarians. So despite gold bouncing since mid-August as those epic record futures shorts started to be covered, the investment selling continued. As of the middle of this week gold had rallied 2.6% out of its deep mid-August low to $1204. Yet the heavy differential GLD-share selling persisted.
GLD’s holdings fell another 4.0% to 742.2t in this past month or so. Out of another 23 trading days, fully 12 suffered draws averaging 0.3%. There wasn’t a single GLD build, no capital flowing into gold from the US stock markets. While Q3’18 isn’t quite over yet, quarter-to-date GLD’s holdings have plunged 9.4% or 76.8t! That’s a major reason along with that futures-shorting frenzy that gold’s price is 3.9% lower QTD.
Unfortunately the WGC’s new Q3’18 GDT won’t be published until early November, about a month after quarter-end. So there’s no way yet to understand just how material GLD’s big 76.8t QTD draw has been to overall global gold demand. But this is serious differential selling, on track for the biggest quarterly draw by far since Q4’16! Then GLD’s holdings plummeted 13.3% or 125.8t helping crush gold 12.7% lower.
Remember what happened in Q4’16? Trump stunned the world by pulling off a universally-unexpected surprise election victory to win the US presidency. Gold was consolidating high before that, but started to plunge afterwards as stock markets soared on taxphoria. With the Republicans newly controlling not only the presidency but both chambers of Congress, investors flooded into stocks on hopes for big tax cuts soon.
Gold is a contrarian asset class, the ultimate portfolio diversifier. It tends to thrive when stock markets are weakening. So as they surged after that fateful late-2016 election, gold was sold hard. And that extreme differential GLD-share selling played a dominant role globally. Per the WGC’s latest data, worldwide gold demand fell 103.2t year-over-year in Q4’16. GLD’s massive 125.8t holdings drop accounted for 122% of that!
So had American stock investors not pared their gold exposure by dumping GLD shares, gold’s worldwide demand would’ve risen. And gold would’ve likely rallied. When American stock investors stage a mass exodus from GLD shares, that resulting physical gold bullion puked into the markets hammers gold much lower. I strongly suspect we’ll see the same thing in Q3’18, that GLD’s draws will dominate overall global demand.
Recent months’ heavy gold-investment selling actually forced a major breakdown in GLD’s holdings in the context of this young gold bull. Gold indeed remains in a bull market birthed from deep secular lows back in mid-December 2015 because it has yet to see a 20%+ retreat from peak levels. For the great majority of this bull-market span, GLD’s holdings rarely fell below 800t. That acted as strong support in gold selloffs.
But the summer-2018 gold selling was so overpowering that GLD’s holdings were driven modestly below 800t in mid-July before falling decisively under in early August. Odds are that strong bull-market support will soon be regained, requiring big investment gold buying. The catalyst could simply be gold rallying on extreme gold-futures short covering bringing back investors. But stock markets will likely play a major role!
The main reason gold consolidated and drifted on balance from Q1’17 to Q2’18 was investors were largely missing in action. GLD saw neither significant builds nor draws in any of those 6 quarters, so gold couldn’t do much even on futures speculators’ endless machinations. It wasn’t until this current quarter that gold broke lower partially on heavy differential GLD-share selling. Stock-market selling will turn this around.
This last chart looks at gold superimposed on the flagship American S&P 500 broad-market stock index (SPX). The big thing that highly motivates investors to return to gold is correction-grade selloffs in the US stock markets. Those are 10%+ declines in the SPX. It was actually moderate SPX corrections marching in back-to-back that originally ignited this gold bull in the first place! Gold thrives on stock weakness.
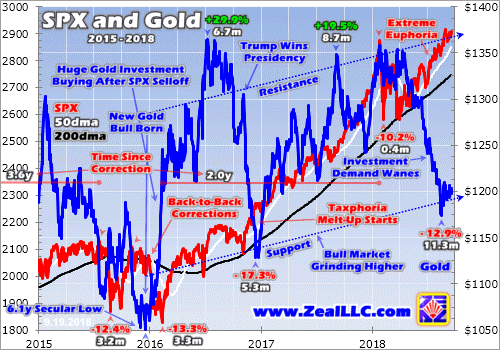
Back in mid-2015 gold looked a heck of a lot worse than today, slumping towards a deep 6.1-year secular low towards year-end. Speculators were selling gold futures aggressively ahead of the Fed’s telegraphed first rate hike of this cycle. They’re convinced there’s nothing more bearish for gold than Fed rate hikes, which is irrational since history has proven the opposite! So investors fled gold in sympathy, dumping GLD shares.
But gold perked up a bit after the SPX’s first correction in 3.6 years heading into late 2015 finally shattered the unnaturally-calm stock-market facade. That was the result of the Fed’s unprecedented quantitative-easing money-printing campaigns artificially levitating the stock markets for years. But that single 12.4% SPX correction over 3.2 months didn’t dent epic complacency for long, so gold soon slumped to deep lows. Related: Mastercard’s New Global Trade Hedge
But then a second correction erupted shortly after, the SPX falling 13.3% in 3.3 months heading into early 2016. That wasn’t major by correction standards, still closer to 10% than 20%. But seeing over a half-year of persistent stock-market weakness finally shocked investors out of their Fed-drugged stupor. They suddenly remembered stock markets rise and fall, and that they should diversify their portfolios with gold.
So gold skyrocketed up out of those last meaningful stock-market corrections, blasting 29.9% higher in just 6.7 months. And you want to know what the dominant driver was? Heavy differential GLD-share buying by American stock investors! As the previous chart shows, in Q1’16 gold surged 16.1% higher on an enormous 27.5% or 176.9t GLD build. Investors purchased GLD shares far faster than gold was being bought.
Per the latest WGC GDT data, total global gold demand surged 188.7t YoY that quarter. Thus American differential GLD-share buying alone accounted for 94% of that worldwide demand boost! This gold bull wouldn’t have been born without US investors’ stock-market capital flooding into gold via GLD. And that continued into Q2’16, where gold rallied another 7.4% on another 16.0% or 130.8t build in GLD’s holdings.
The WGC reports overall world gold demand climbed 123.5t YoY that quarter. Thus capital pouring into GLD was responsible for 106% of the total global increase in gold demand! In this entire young gold bull so far, the key to gold’s fortunes have been what American stock investors are up to. Gold powers higher when they are aggressively buying GLD shares, then slumps when they are selling them at differential rates.
In addition to gold getting hit on that record gold-futures shorting in recent months, another reason for the recent investor mass exodus was the record-high SPX. In late August it hit a series of new all-time peaks for the first time since late January, spawning epic levels of complacency, greed, and even hubris. At extreme highs investors assume stocks will rally forever, so they have no need for counter-moving gold.
Interestingly after another long 2.0-year span without a stock-market correction thanks to that taxphoria rally following Trump’s victory, the SPX corrected in early February this year. It plunged 10.2% in just 0.4 months, which was a sharp-yet-shallow-and-short correction. It was largely ignored by euphoric investors just like the first correction in years heading into late 2015. The next SPX correction will be the second.
Will it rekindle big new gold investment demand just like that second correction leading into early 2016? I think there’s a good chance it will. Risks abound in these lofty stock markets that investors will no longer be able to ignore in the next material selloff. They include literal bubble valuations today, mounting trade-war threats, and most importantly the Fed’s accelerating quantitative-tightening campaign to start unwinding QE.
I’m planning on writing an entire essay on Fed QT and these record stock markets next week, as QT is on the verge of going full speed in Q4’18. Stock investors have been able to ignore QT despite stocks being clearly levitated by QE, but they can’t disregard this unprecedented threat forever. Gold should be a go-to asset class when their fears of what havoc QT will wreak on overvalued QE-inflated stocks finally mount.
So investors’ recent anomalous gold exodus will likely soon reverse. It is already slowing as that extreme gold-futures short selling abates. After plunging 5.6% in August, GLD’s holdings are only down 1.7% month-to-date in September as of the middle of this week. Gold investment selling looks to be finally exhausting even with stock-market euphoria still off the charts. Soon buyers will return, slowly driving GLD builds.
And as these incredibly-high and precarious stock markets inevitably roll over, that initial trickle of gold investment buying will eventually grow into a flood. The last time investors got worried about weakening stock markets in early 2016, gold soared 29.9% higher in just 6.7 months birthing today’s bull. And the gold miners’ stocks greatly leveraged those gains, skyrocketing 182.2% higher in roughly that same span!
The only reason those strong gold and gold-stock advances stalled and broke was that extreme taxphoria stock-market rally in the wake of Trump’s surprise win. That frenzied corporate-tax-cut anticipation is over and won’t be back, as those tax cuts went into effect this year. There’s nothing left to spawn super-bullish sentiment anymore. As stock markets roll over, gold and the battered gold stocks will return to favor.
The bottom line is investors’ recent exodus from gold is likely on the verge of reversing. As revealed by GLD’s holdings, their heavy selling is already slowing as that extreme record gold-futures shorting winds down. Gold investment demand will return with a vengeance once these lofty stock markets inevitably roll over into their next correction or long-overdue bear. That will restore gold to favor for diversifying portfolios.
The last back-to-back stock-market corrections actually ignited today’s gold bull almost a few years ago even though they were modest. American stock investors alone flooding into GLD shares catapulted gold sharply higher. When the next serious bout of stock-market weakness unavoidably arrives, they will once again remember stocks can’t rally forever. Then they will start flocking back to gold to hedge falling stocks.
By Adam Hamilton via Zeal LLC
More Top Reads From Safehaven.com:


