Tonight I would like to step back and take a serious look at silver. I believe the chartology is beginning to speak to us that this is a huge opportunity that is setting up right now for those who can be a little patient. But first let’s take a quick look at todays market.
That’s a screen shot I took off of the lead headline on Drudge today, so the public now knows…the cats out of the bag. That’s right you heard it here first as weeks ago this theme was outlined and made clear that it was coming our way in a hurry. The PM markets responded accordingly.
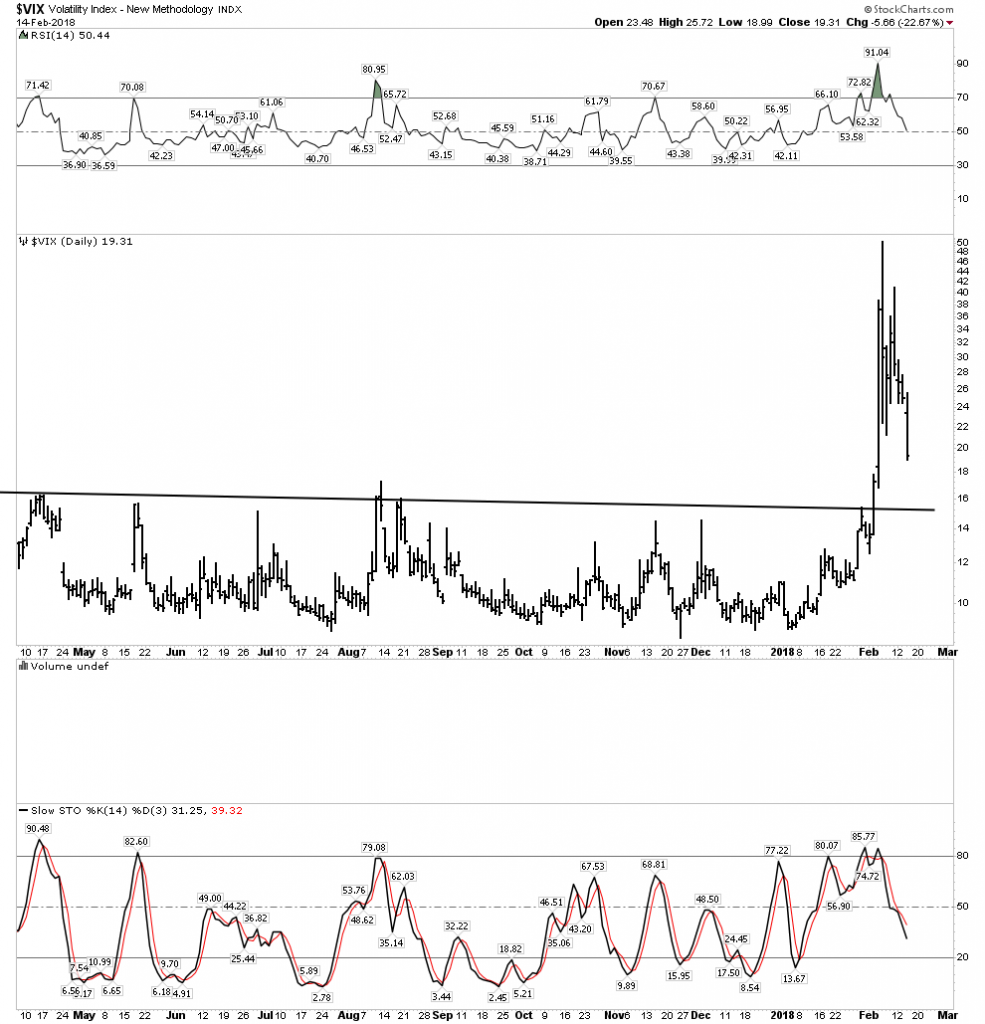
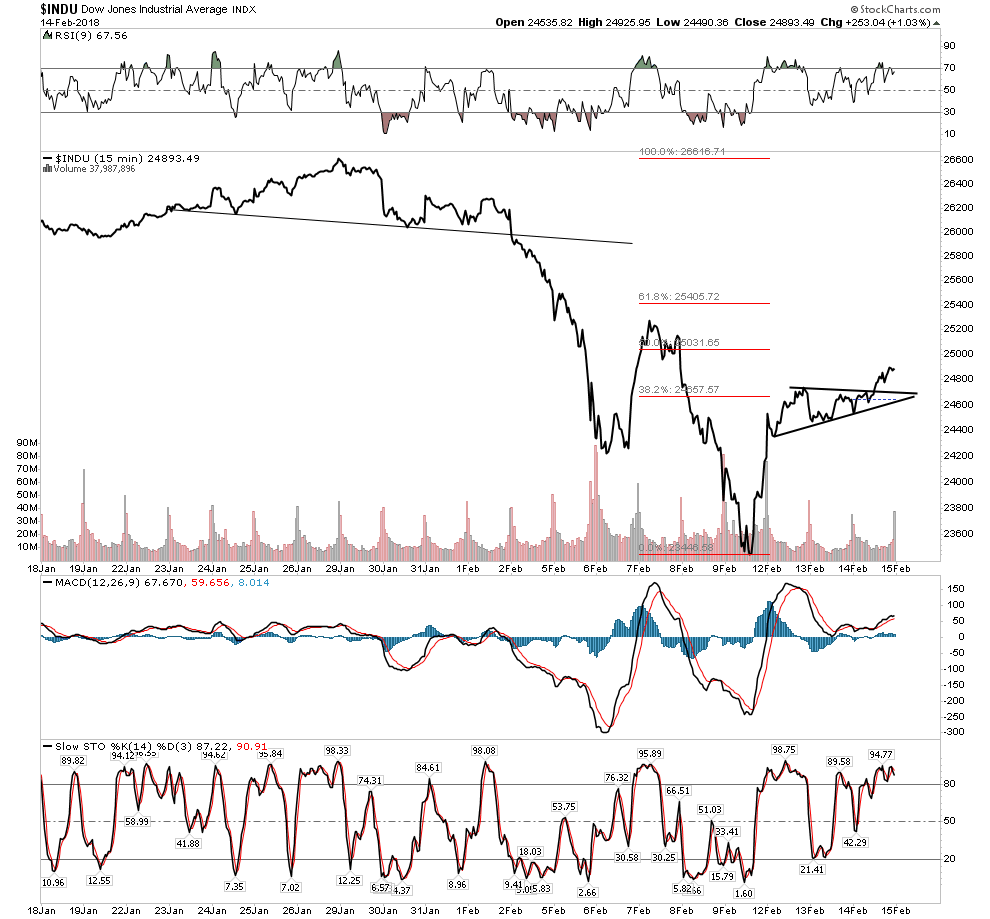
In the weekend report it was pointed out that we should all keep out eye on the VIX. If the VIX stayed elevated expect more trouble for the stock market, it it dropped below 20 then we could expect the market to have a decent rally or even recover its losses of the past 10 days. Well today we got the move below 20 and the market is starting to look a bit better as the chart below shows.
Dow– Note the mini break above the consolidation
I have made my opinion clear that the general stock market could regroup and recover, but I am not interested in playing it. I see too much opportunity in the upcoming bull market in the PMs and the resource sector.
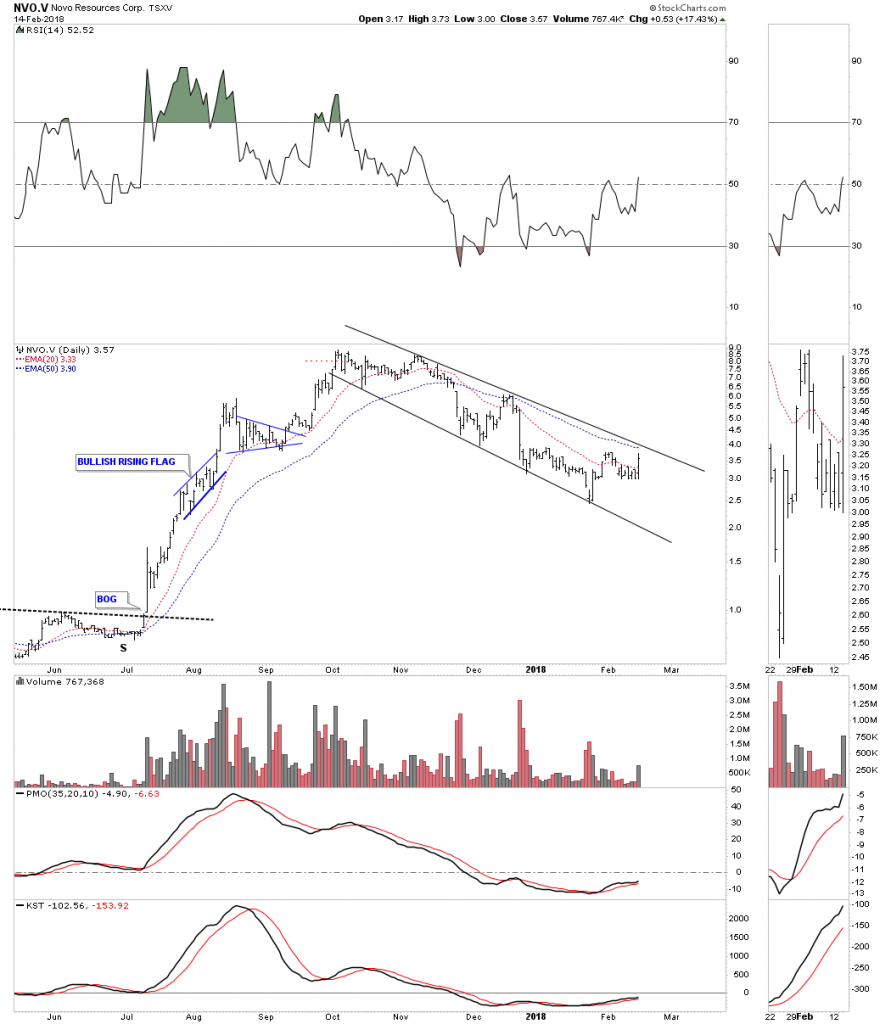
Novo Wakes Up
Another little surprise today was Novo resources busting a move. Again the weekend report noted that it appeared that the worse may be over and it was prepping to reverse its trend and start heading higher. Hopefully it will have the legs to break above the channel in the chart below.
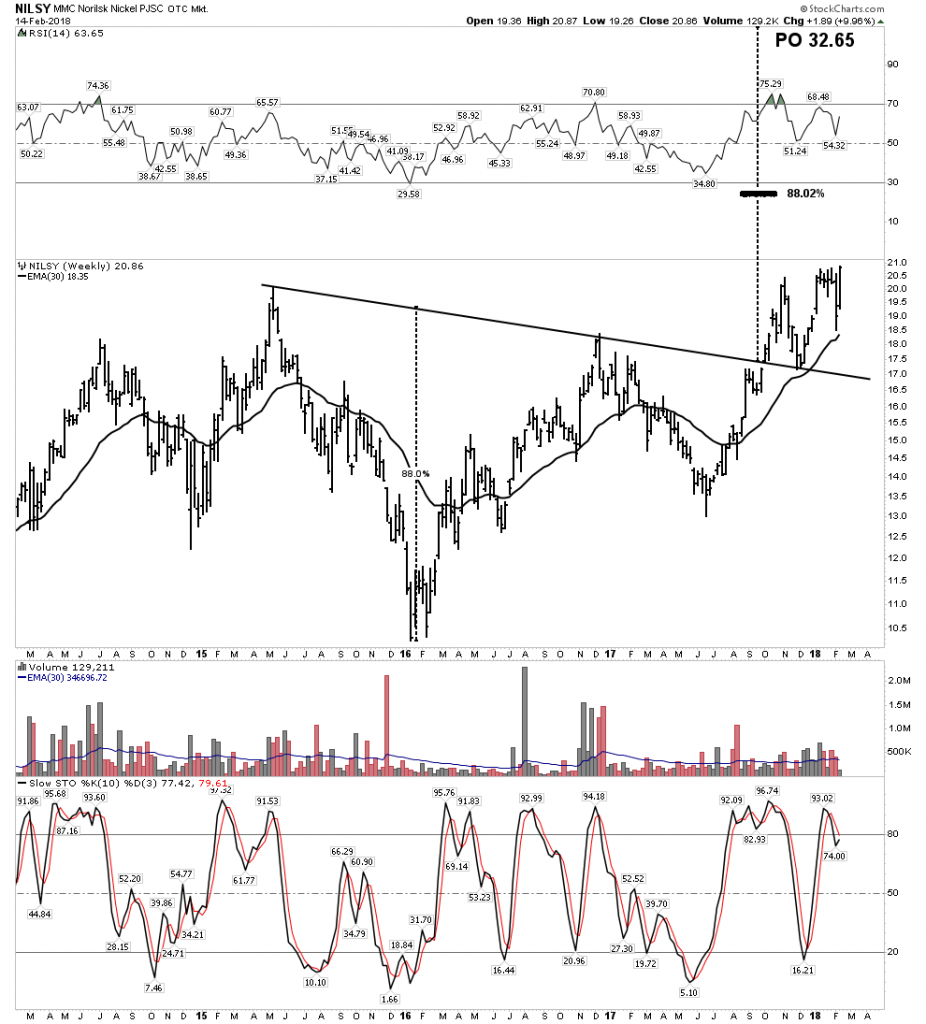
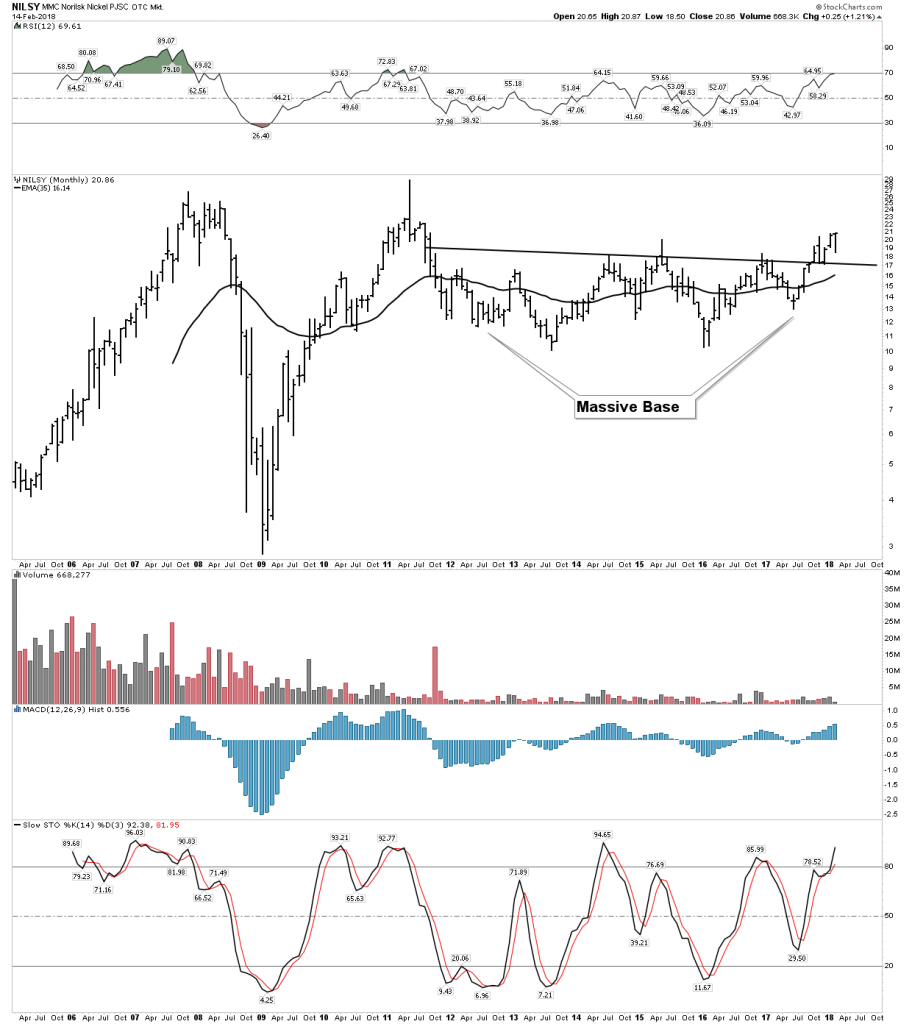
Norilsk wasted no time today to reassert itself. This is our little core nickel play considered a safe way to play the battery metal EV theme.
Big Base=Big Move
Getting Serious About Silver
I have to tell you that this realization has just hit me like a 2X4 in the head. Frankly it is totally counter to my understanding of the fundamentals of silver and how it fits in the big picture of the sequence of which asset classes perform first in a new bull market. It has always been my understanding that silver is the latecomer to the party. That’s the way it has been in the past. After all silver is chiefly an industrial metal since its traditional monetary role has faded. So when an economy enters a recession silver should weaken right? After the devastating bear market from 1929-1932 silver actually bottomed 6 months after the DOW. Whereas the DOW completed its 89% decline in July 1932 silver continued declining until Dec 1932. When the gold stocks bottomed in Jan 2016 the silver stocks severely lagged the gold stocks for the first 6 weeks of the rally.
So it’s normal that silver comes along later and puts in its big gains once the market gets going. That’s the consensus since that’s how it has been in the past. But here is the value of chartology… it tells us real time if something different is happening. It appears to me that the silver stocks are getting ready to begin their advance in the next phase of the bull market. They actually appear very bullish as they have the appearance of being in the later phase of their consolidation of the big move of their phase I advance.
The Most Important Trait of a Successful Investor…Patience
This past week I noticed several comments on the forum expressing frustration that the PM stocks were not acting like they were “supposed” to. Inflation goes up the PM stocks should immediately respond also. When the stock market goes down gold stocks are supposed to go up- right? Let me just say that we all need to have some patience. These things take time, we can’t be in the instant gratification business. In the future I plan on writing a piece explaining the dynamics of what makes the gold stocks run in a bull market. But for now let’s just trust the charts and see what they are saying:
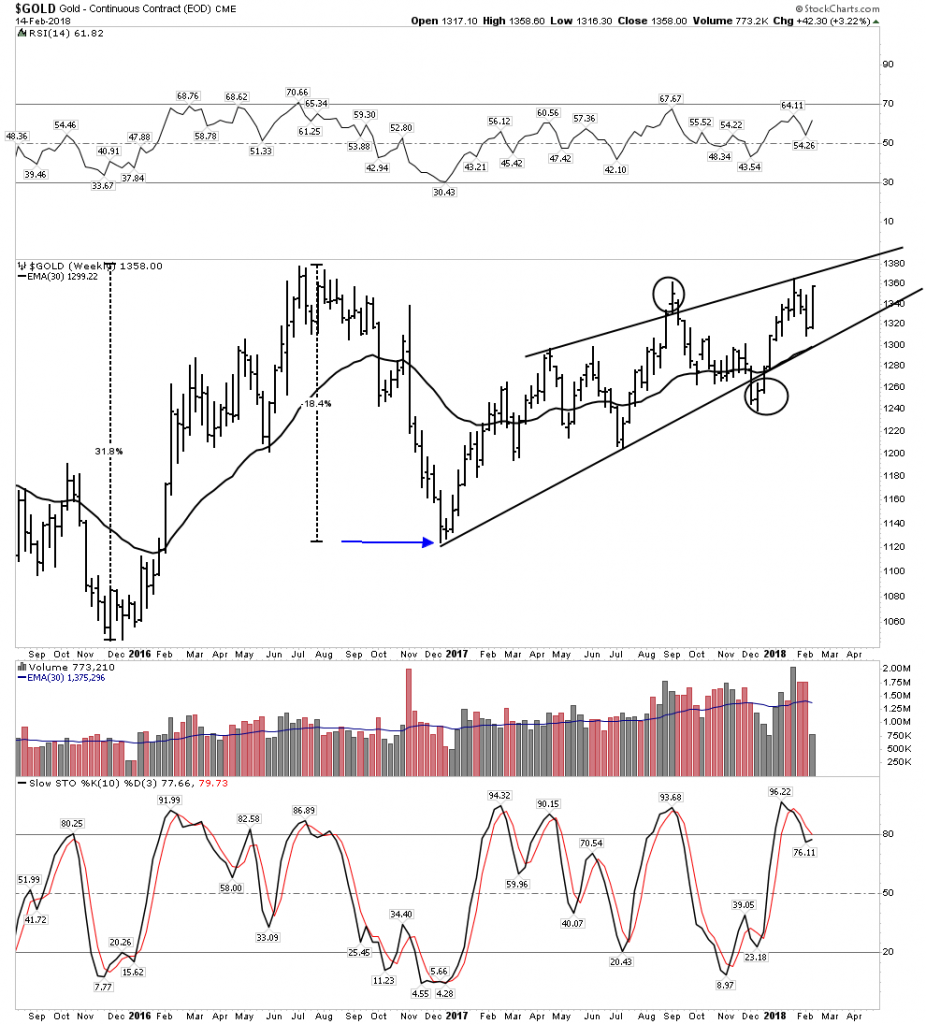
Gold & Silver- actually what we would expect
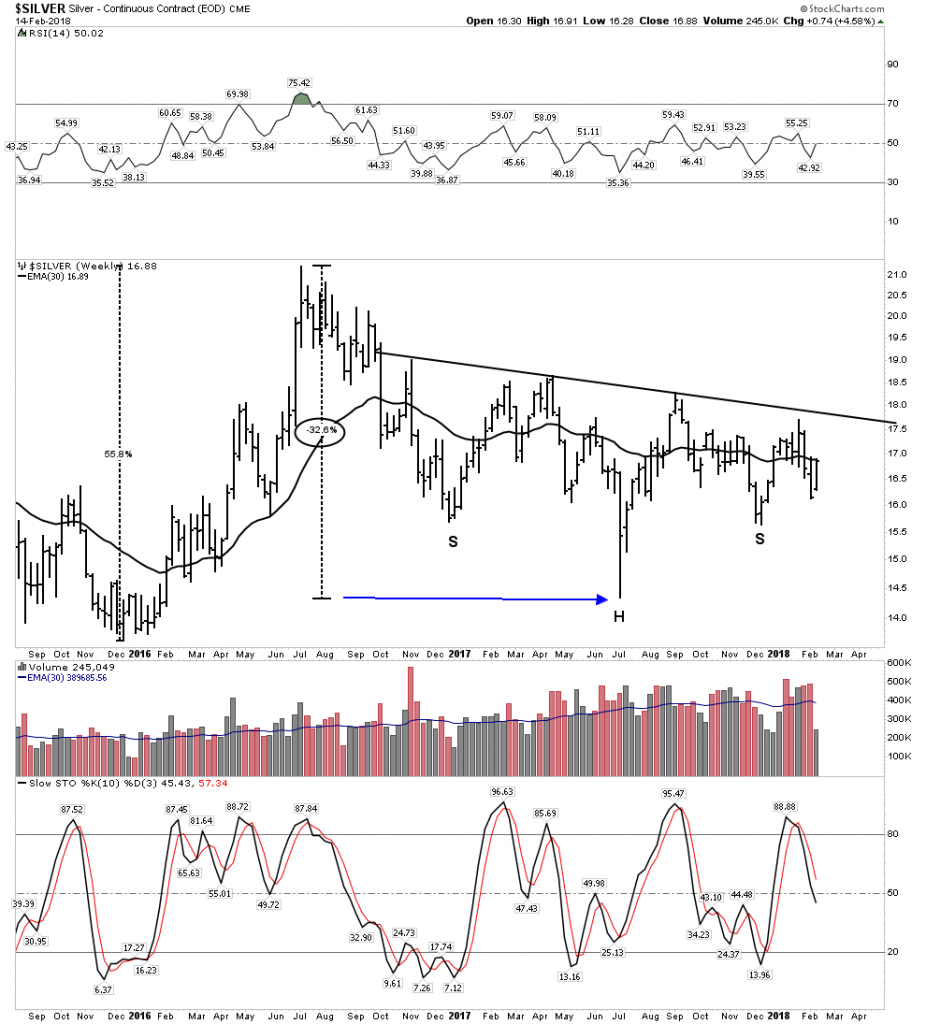
We have discussed before that gold and silver began their bull market in Dec 2015. They both had a great phase I rally into late July 2016. Gold then corrected and consolidated this move over the next 6 months and put in its correction bottom in December 2016. That was an 18.6% decline. It then began Phase II of its bull market where it remains today. Silver also peaked in July 2016, but it took an entire year, until July 2017 to correct the first leg up. That correction or consolidation gave back 32.6% of its first leg up. It appears silver is now in the early stages of its bull market phase II. Therefore we can see these metals have performed as we would have expected. Gold rallied 31% whereas the more volatile silver rallied 55%. When the corrections came gold lost 18.6% in 6 months while silver lost 32.6% in 12 months. This is classic behavior.
Silver…Playing catch-up, but getting ready to romp.
One more thing, We are in a real bull market here, although early stages. It’s the real deal, just look at the thin blue volume line on both charts representing the 30 W EMA of volume. It is in a constant expansion. Volume rises in a real bull market. It is noteworthy that volume has slowly declined in the S&P over the past 9 years….hmm…
It’s Time to Wake-Up and Smell The Coffee
But here is where we need to sit up and pay attention. The silver stocks now appear as a group to be ready to finish the correction they have been in for the past 18 months. Where I have been content to think the bottom in these stocks will likely come during the seasonal doldrums of late summer where the PMs usually go to sleep, it appears to me the turn up may be sooner than that.
The Long Term Monthly Charts- The big picture jumps right off the page
After the decline of most stocks over the past 2 weeks the daily chart patterns of the silver stocks look particularly gruesome. Looking at these charts does not motivate one to go right out and buy these things. Frankly they are downright ugly.
But here is the thing…When one looks at the monthly charts some of these patterns simply jump right off the page and say buy me now!
MAG Silver
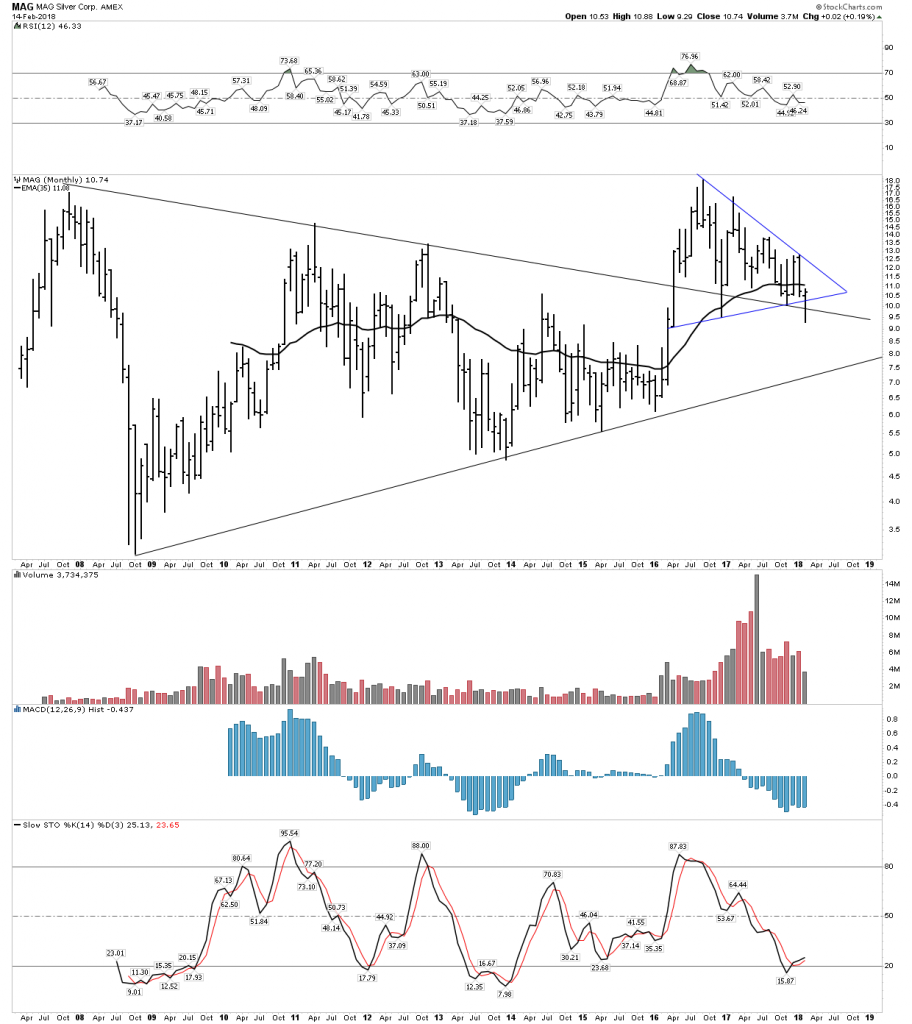
Mag was named my Blue Ribbon silver pick in the year end edition. In the chart below we take a long term 10 year monthly look at MAG. OMG is this a thing of beauty! Understand the principle of coiled energy and when it is released it powers a move. It coiled energy for 7 years inside of that big triangle. The BT to its breakout of its horizontal triangle has been on going for two years now. Furthermore the recent drop below the upper triangle line is likely a classic wash out move just before it launches on its power drive. IMO the chartology here is telling us this is a perfect entry position.
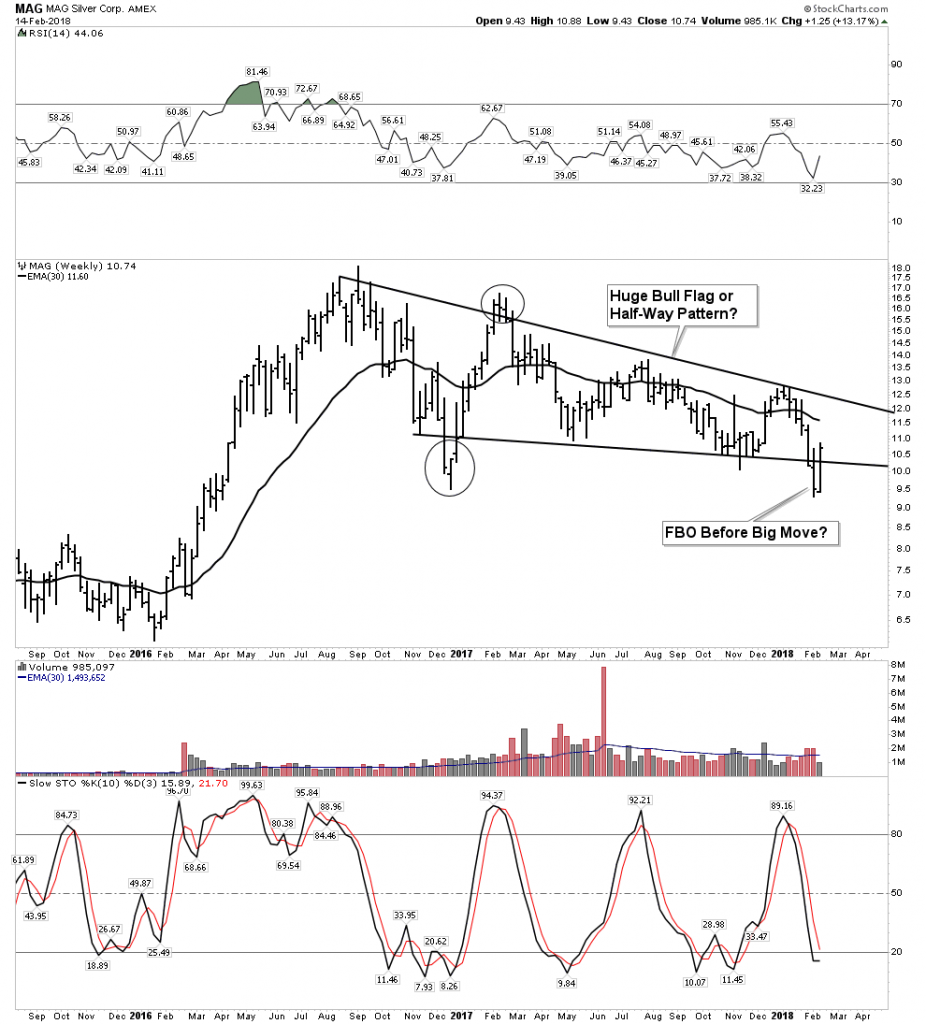
Looking at the weekly chart we have to ask could this simply be a half-way pattern? When MAG was began it was Dr. Peter Megaw purpose to find a silver deposit that would be profitable at $4 silver since that was back in the early 2000’s before silver made its advance. MAG is super grade.
Fortuna- Monthly
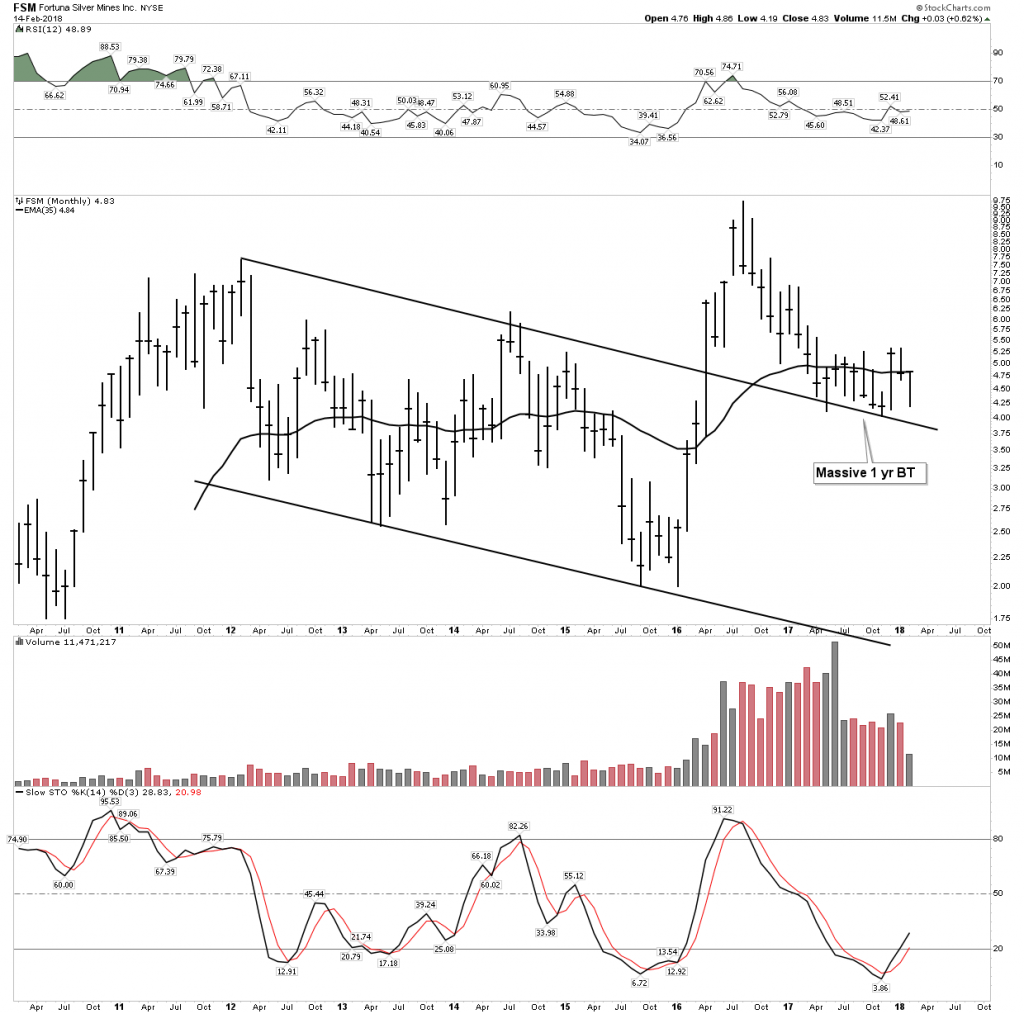
Again here we have a long term chart that jumps right off the page at you. Fortuna has bored me to death over the past year. Well now I understand why, it is simply taking its time to build its BT base and getting into stronger hands for the big move ahead.
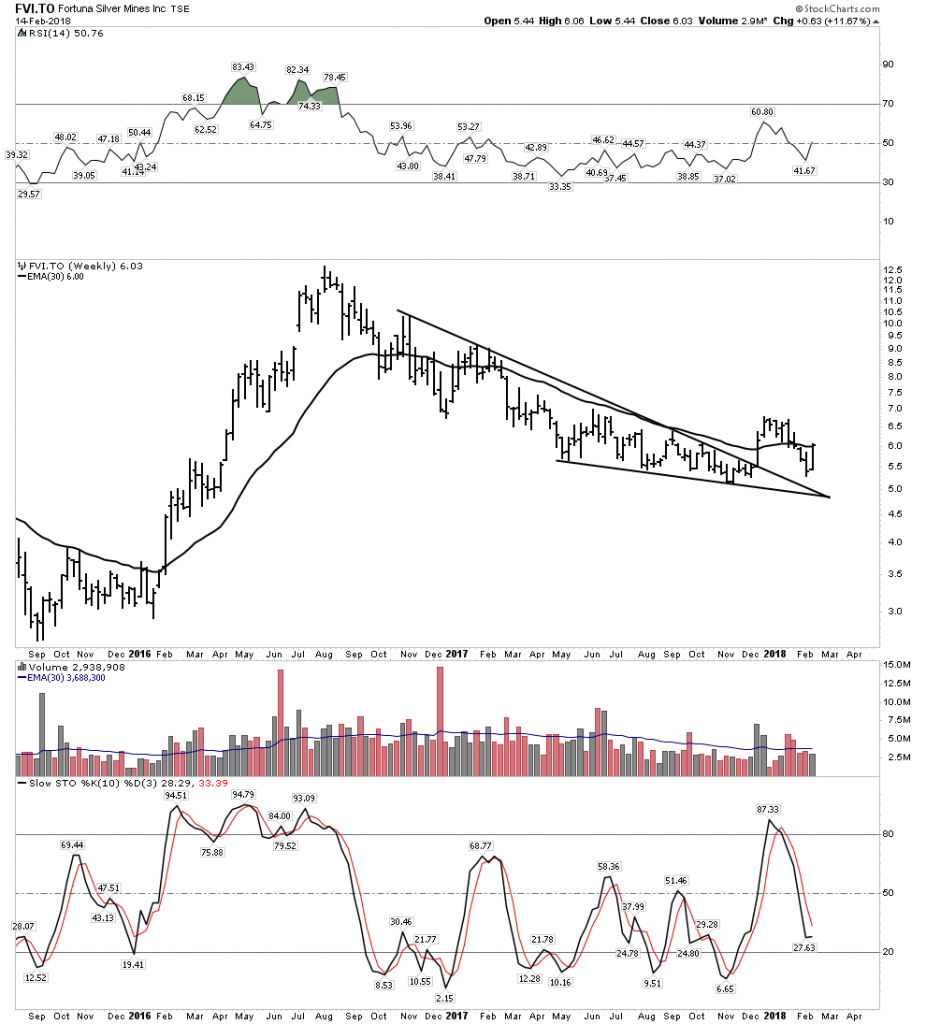
Fortuna Weekly:
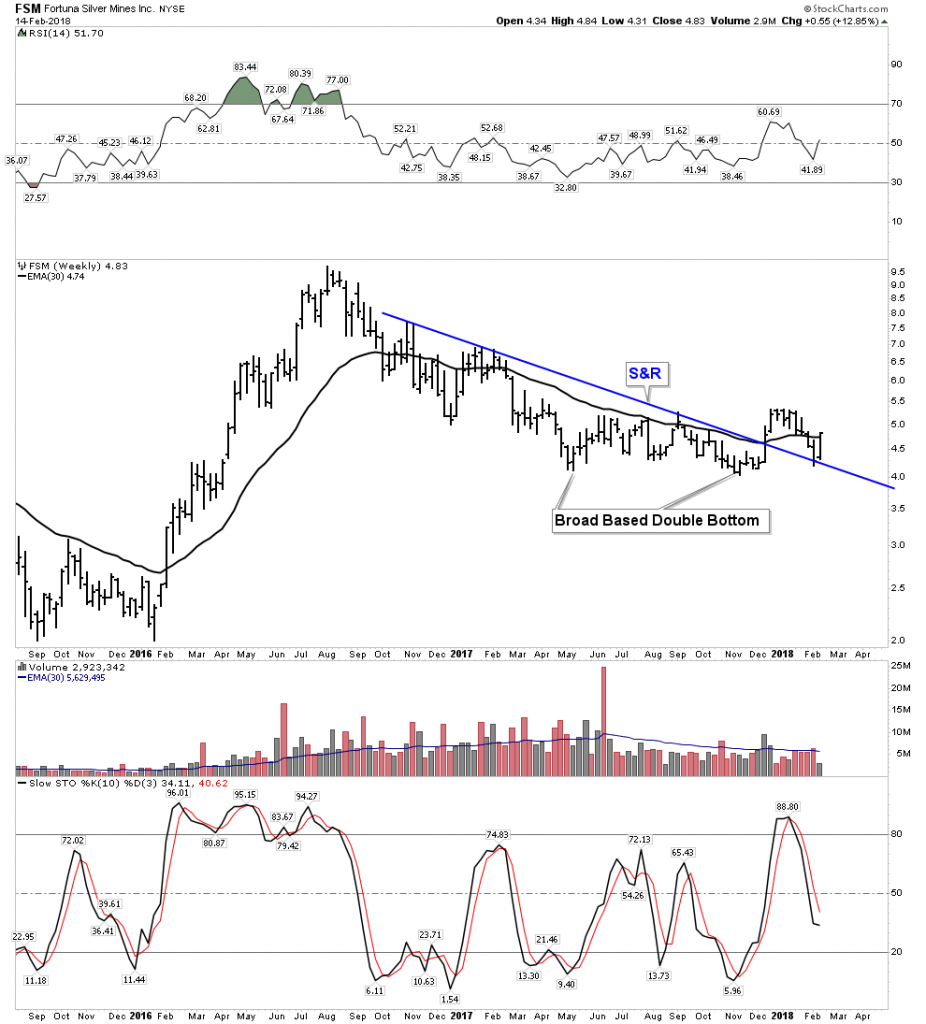
Fortuna not only has silver but has massive high grade zinc. Zinc will come into its own this year. Note today it broke above its 30 W EMA….nice.
Pan American– Ross Beaties Powerhouse
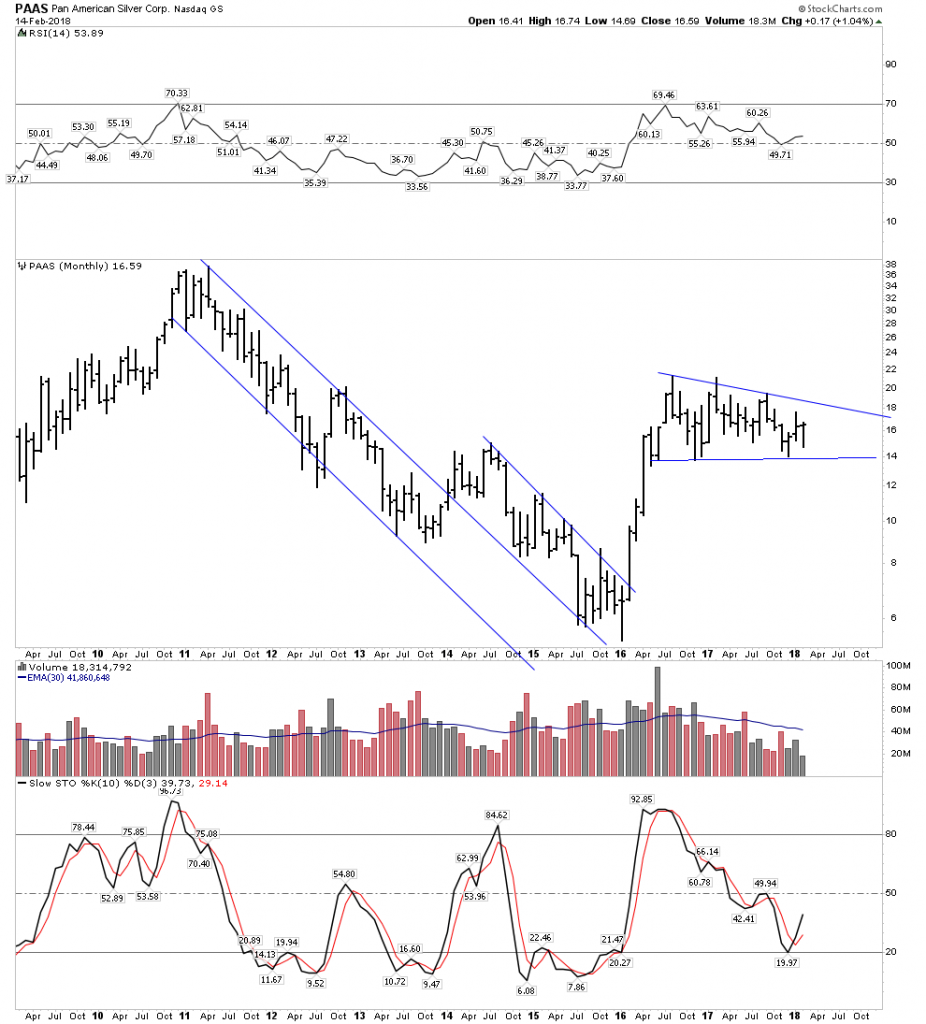
The monthly on PAAS shows a nice bull flag consolidation. It has been going for just under two years, when it breaks out they have lot’s of upside leverage:
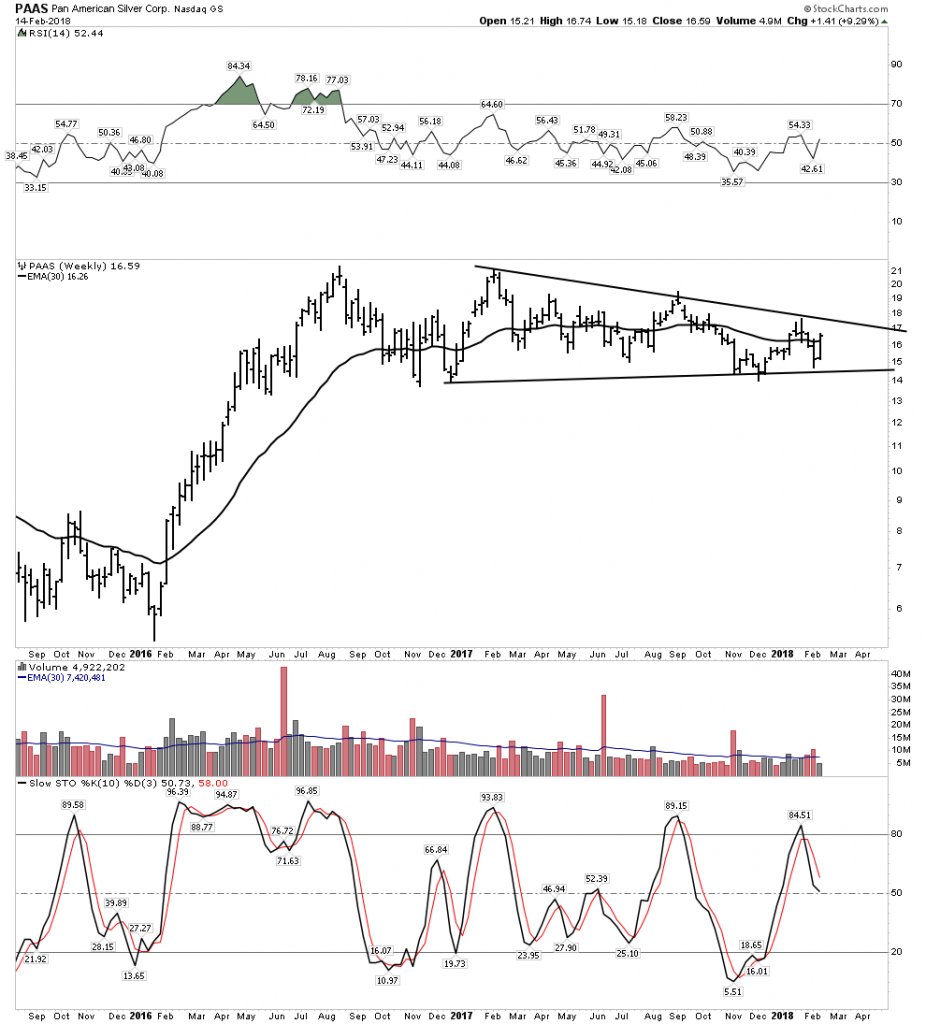
The Weekly shows the resistance to giving up any ground.
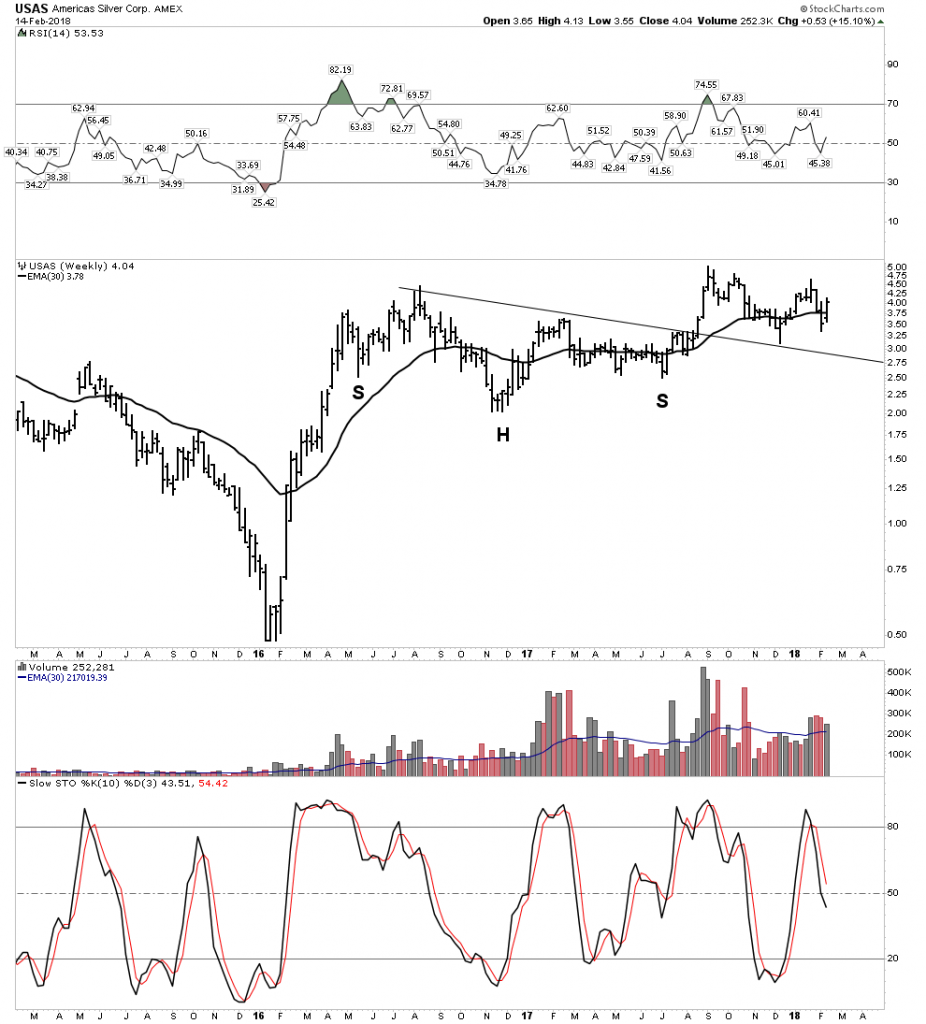
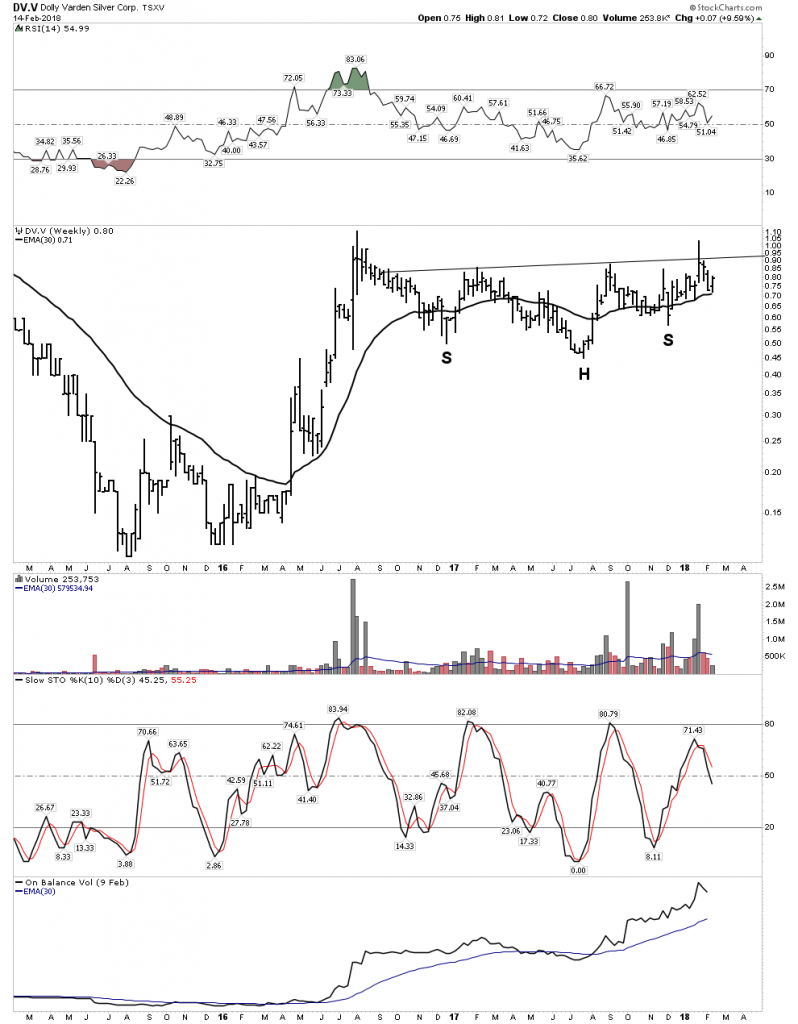
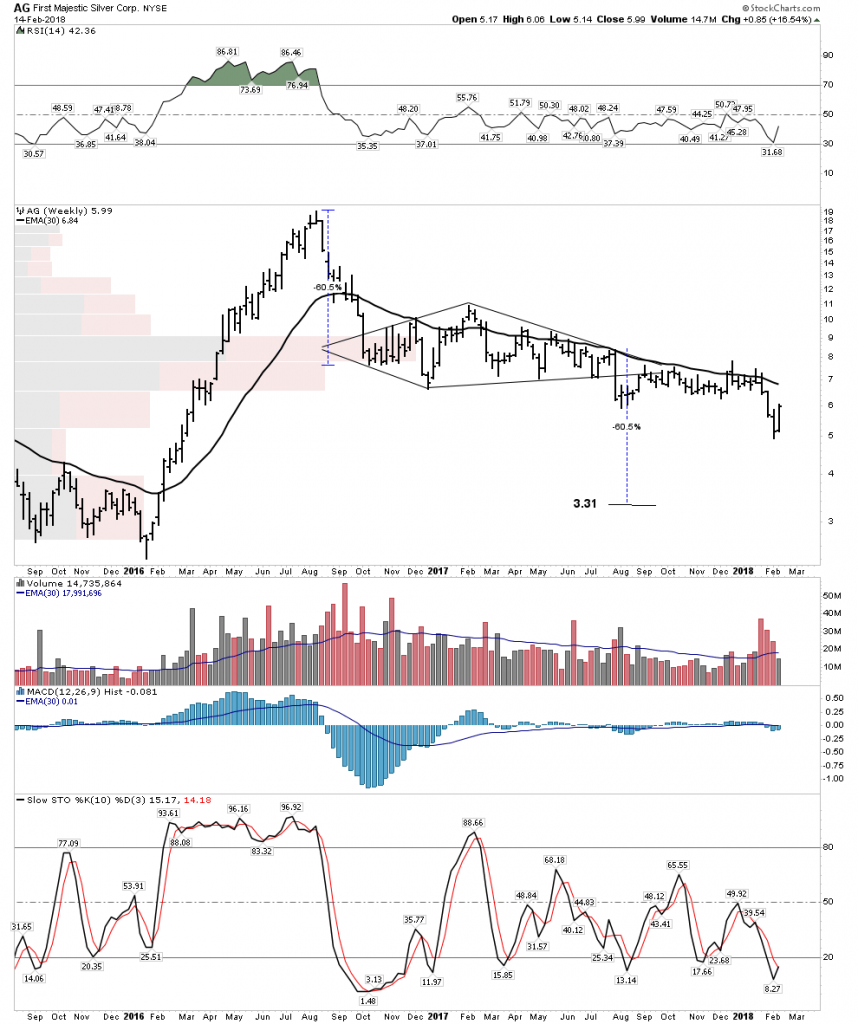
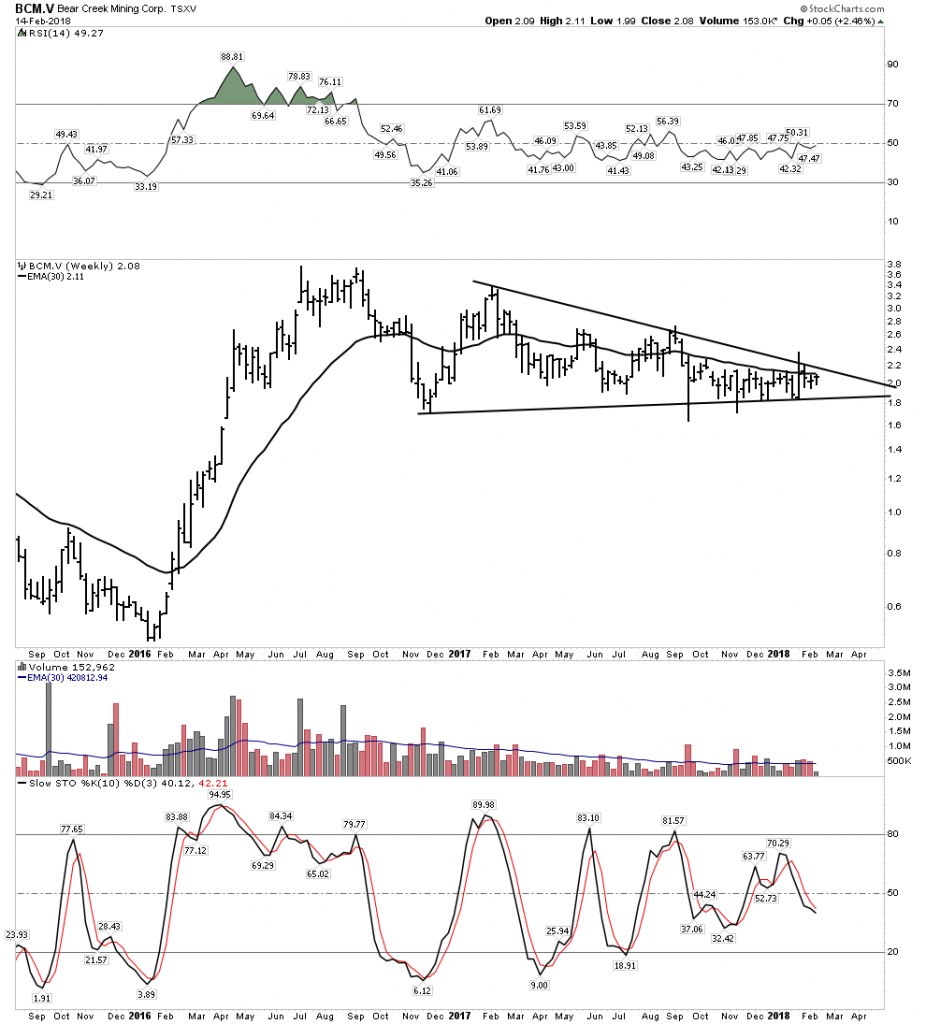
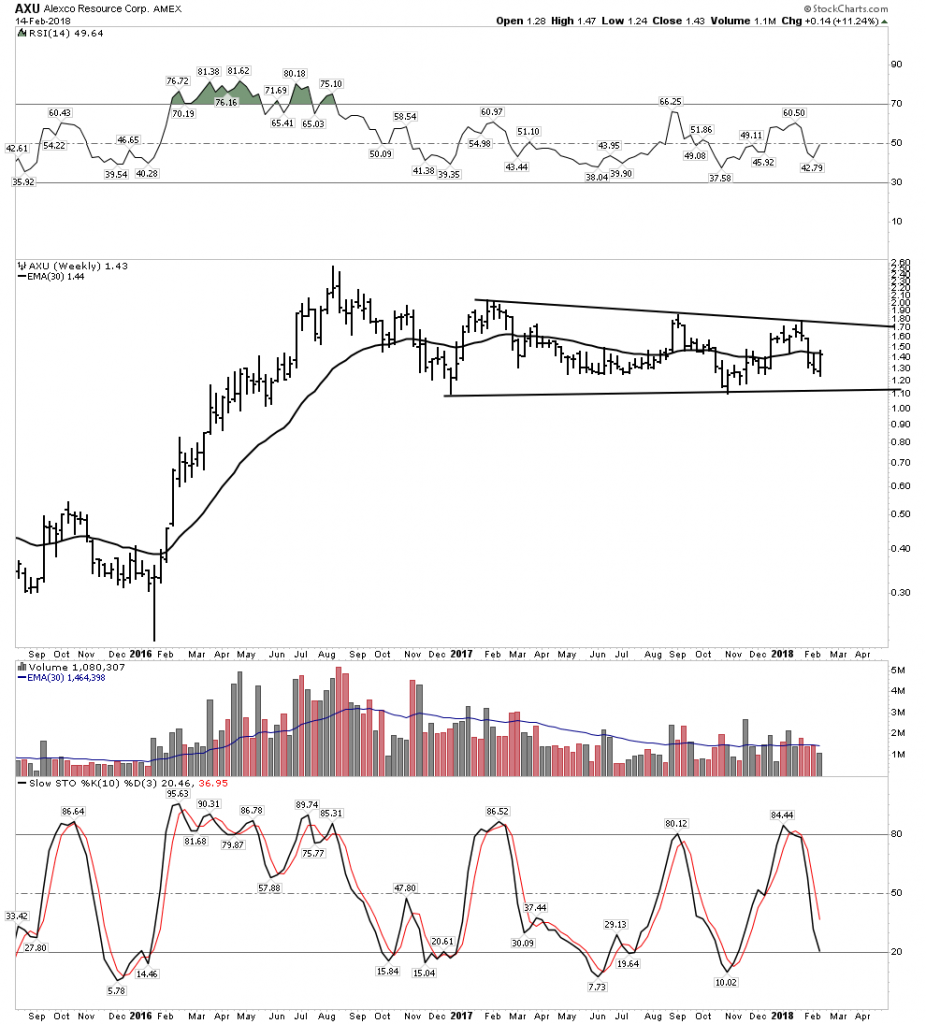
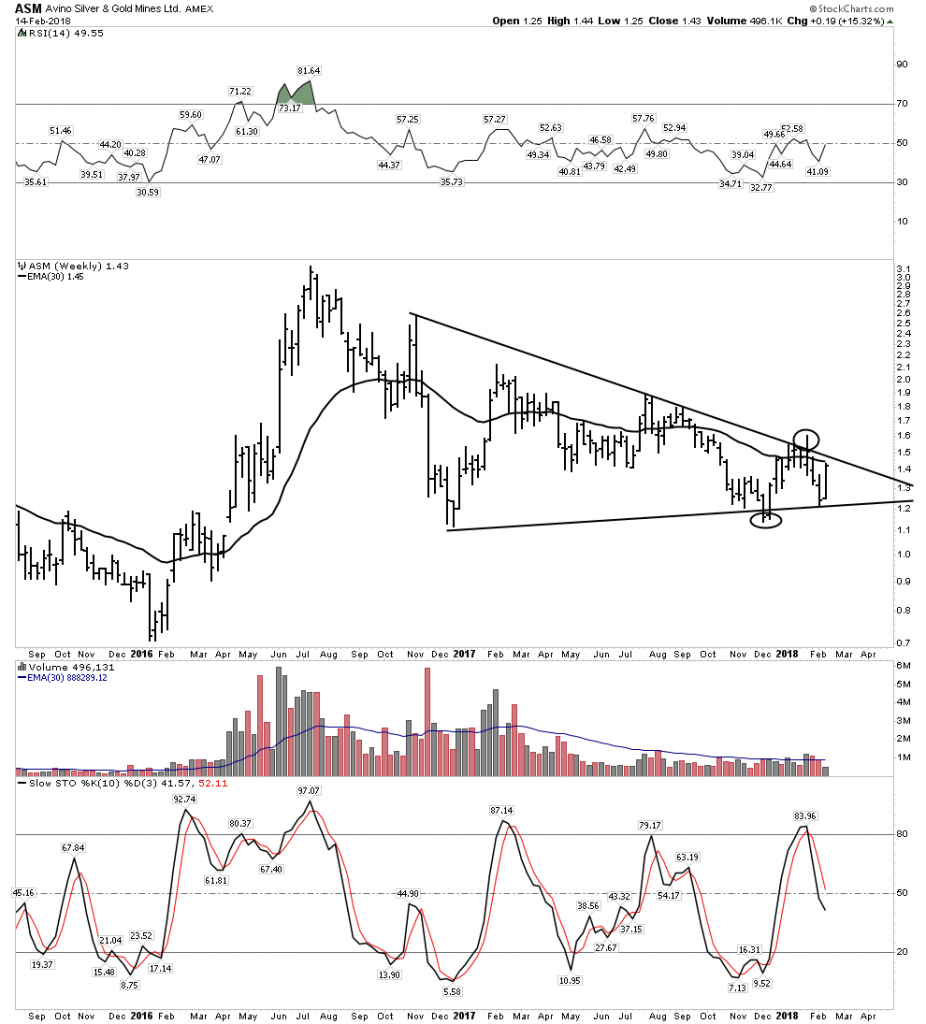
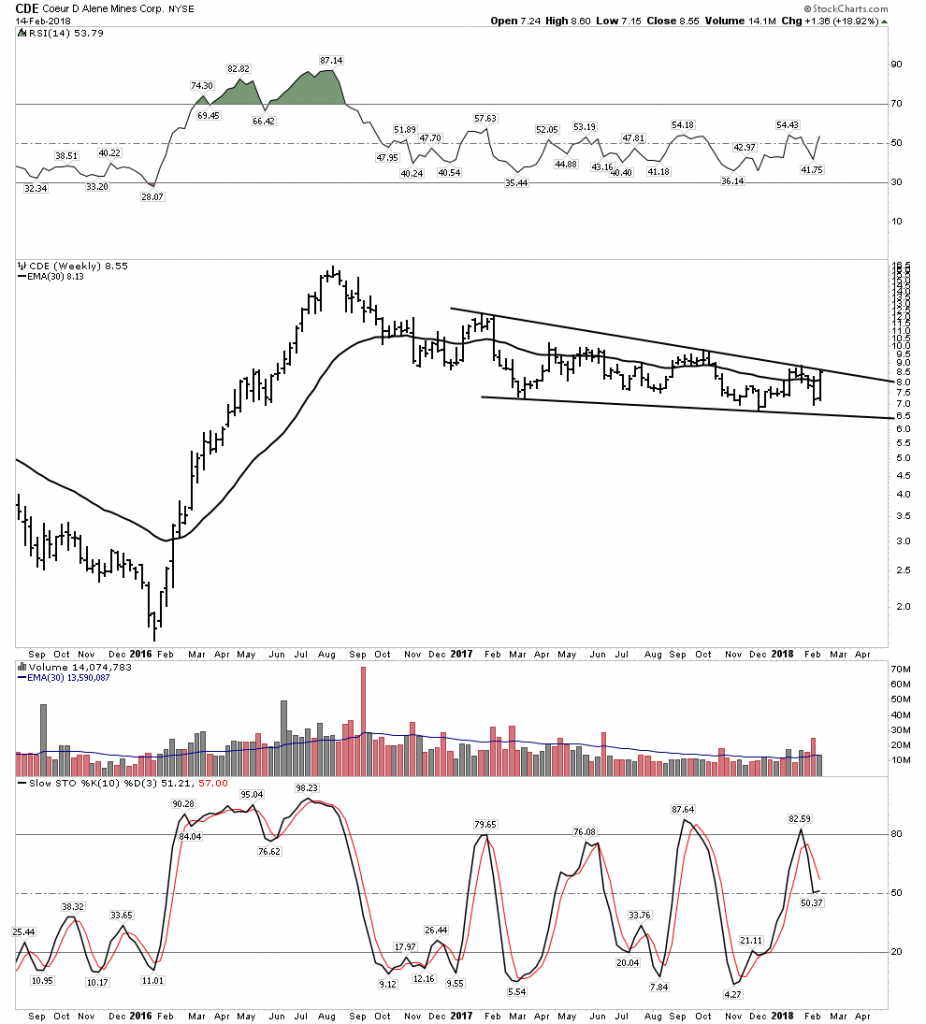
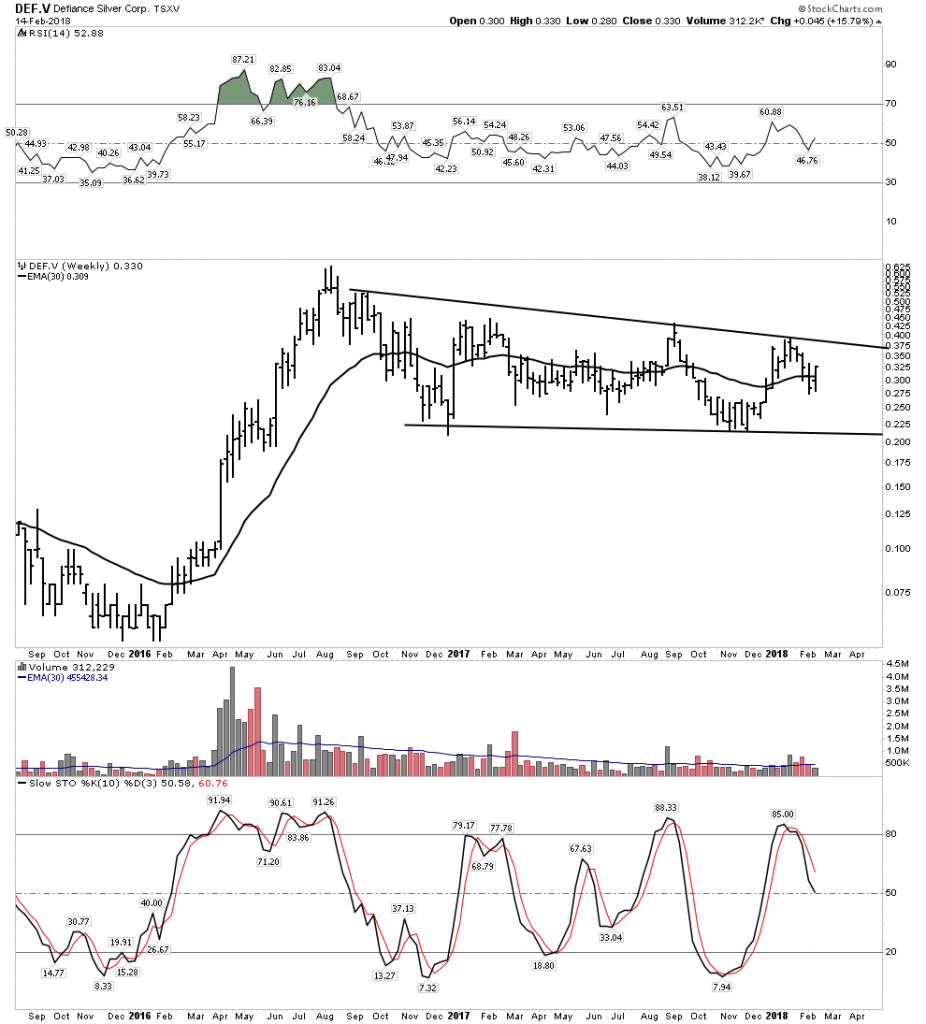
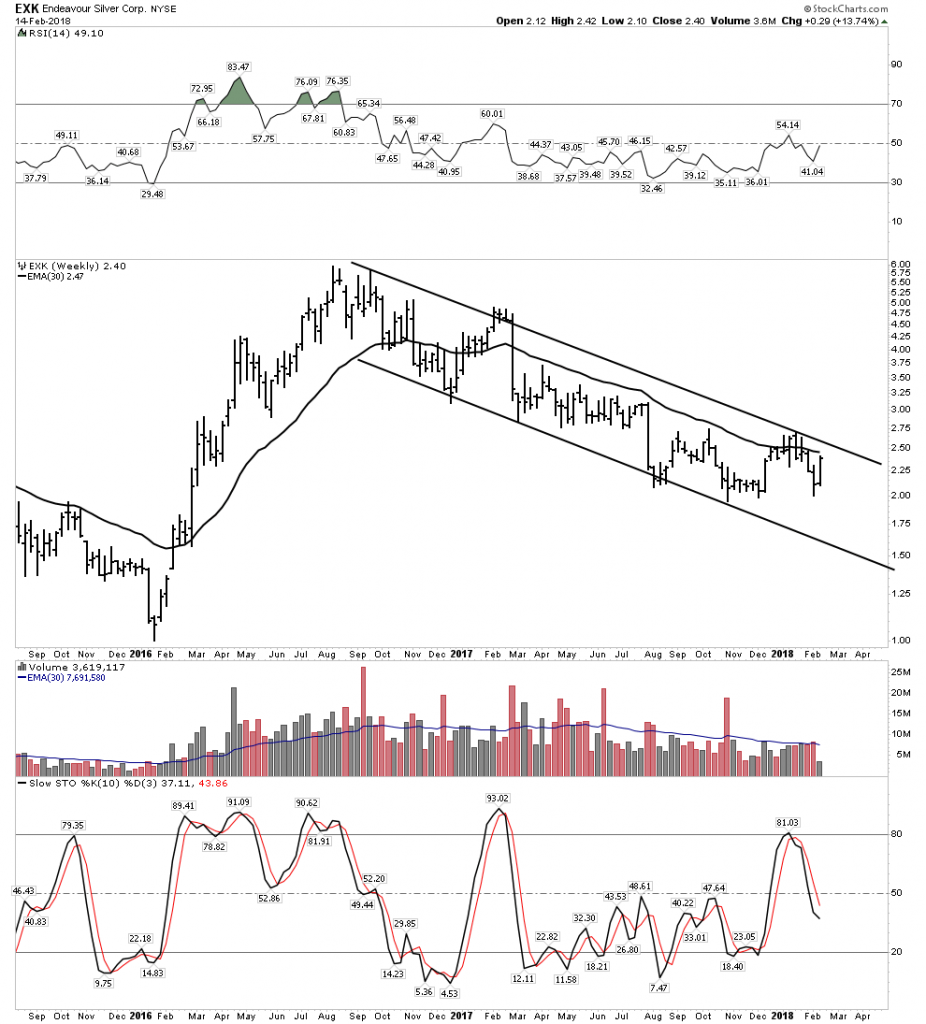
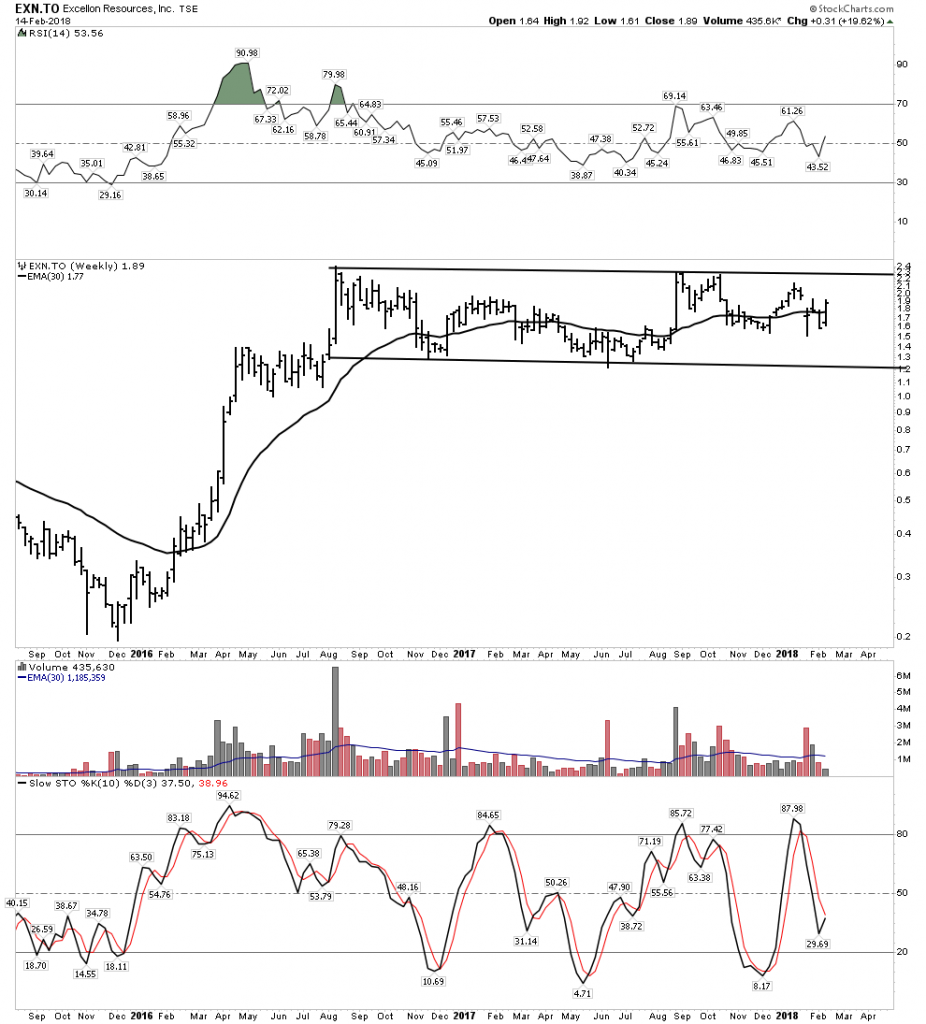
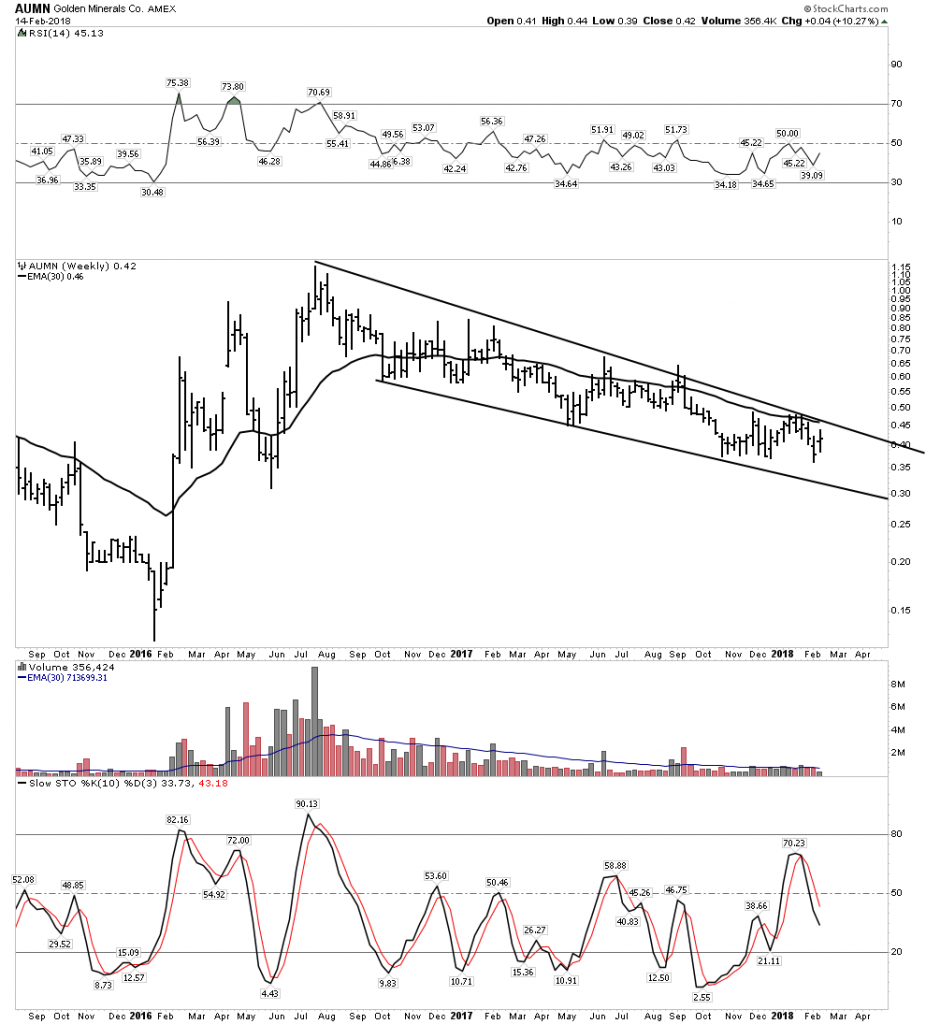
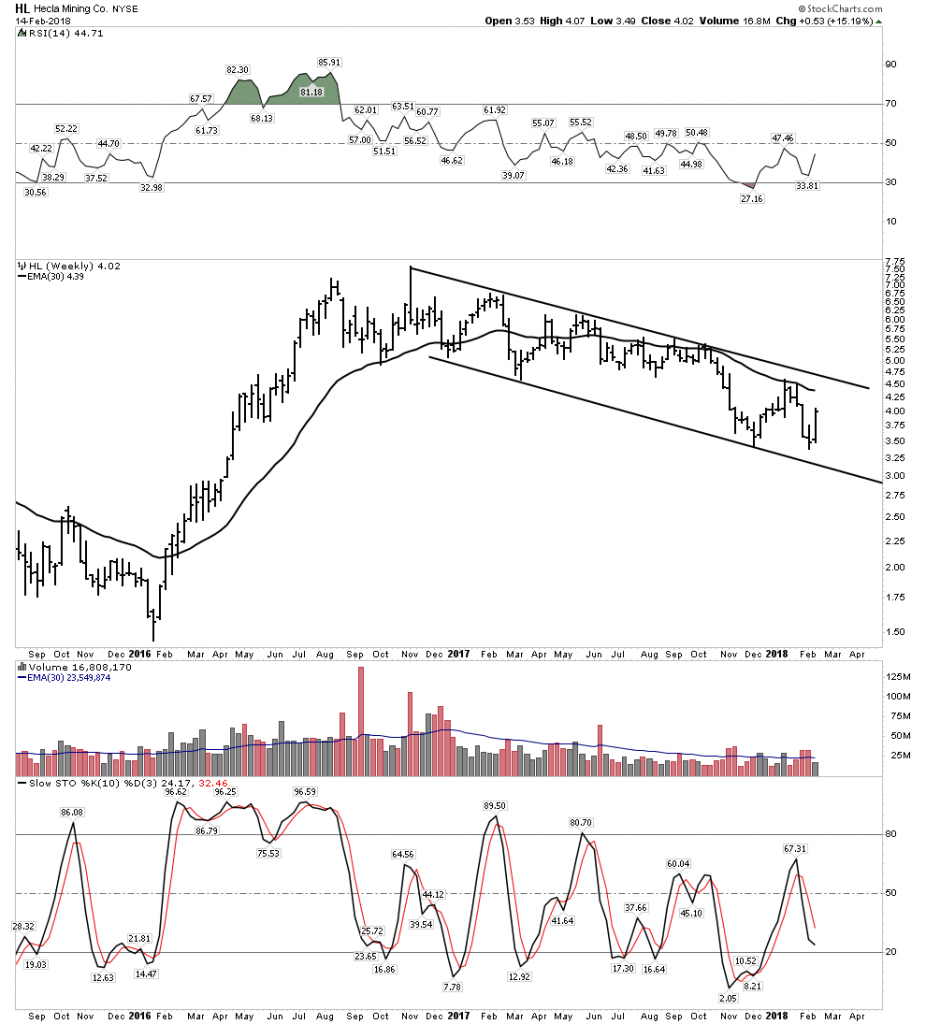
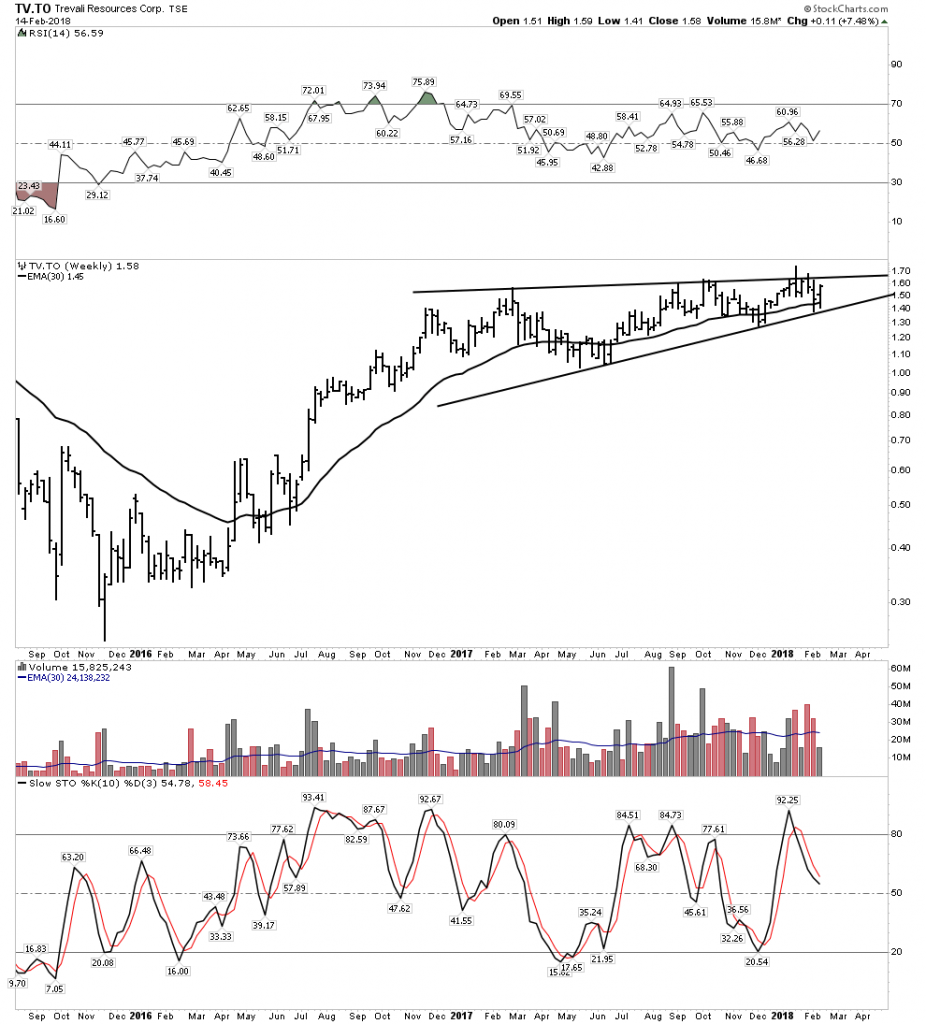
Again I am not going to be displaying the daily charts as the noise in them detracts from the big picture. Below I will show numerous weekly charts of silver companies that are in different stages of finishing up their long correction. You can see that there remains little time remaining before the big move begins:
USAS superb:
DV– My personal favorite after MAG
AG Another big primary producer. Maybe it will never reach 3.31
BCM– Super Leverage
AXU High Grade
ASM– The Spanish called this “Mountain of Silver”
CDE-used to be the crap company of the sector… Times have changed.
EXK– Solid Mgt.
EXN– This is a large holding of Eric Sprott
HL Big Name Producer
TV– Little known but on the move
One of the key things to remind oneself of is that over the past 2 weeks with the markets crashing all around, these stocks have remained in their consolidation patterns. No technical damage on the weekly charts. This is very encouraging and speaks to the case that these stocks have absorbed all the punishment intact and they are in stronger hands now. They are ready to advance. I ask you can you say the same for the average stock in the S&P 500?
By Rambus Chartology


