


The Federal Reserve’s endless machinations really affect the gold price, sometimes confounding traders with seeming illogicalness. This week the Fed cut rates again, which has really boosted gold in the past. Yet it plunged 1.7% in less than an hour after this latest decision before bouncing back by the end of the week! While gold’s Fed reactions often look capricious, there’s a method to this madness. Traders need to understand why gold moves on Fed actions.
The day before this Wednesday’s latest policy decision by the Fed’s Federal Open Market Committee, I warned our weekly-newsletter subscribers about the downside risks to gold even if the Fed cut as widely expected. “If the Fed doesn’t prove dovish enough, gold is really at risk of starting another downleg given specs’ gold-futures bets.” What the FOMC actually does is multi-faceted, with multiple avenues to affect gold.
The FOMC meets 8 times per year to make monetary-policy decisions, about every 6 weeks. While these meetings run 2 days, the actual decisions are always released Wednesdays at 2pm New York time. The media focuses heavily on what the FOMC does with the federal-funds rate it controls, but that’s rarely any surprise. Both Fed officials and federal-funds-futures trading telegraph hikes and cuts well in advance.
The collective trading in the federal-funds-futures market creates implied probabilities of what the FOMC is likely to do in its next meeting. The members of the FOMC who make rate decisions, Fed governors and an annually-rotating subset of regional Fed presidents, closely watch federal-funds futures. The Fed almost always does what the markets expect when the implied odds exceed 70% going into any decision.
Between the previous FOMC meeting in late July and this week’s decision, the futures-implied odds for a second rate cut this week averaged 94%! So the Fed pretty much had to cut again, even though it wasn’t justified economically, to meet traders’ expectations. If they universally expected a cut but the Fed failed to deliver, the stock markets would likely plunge sharply. So the FOMC almost never risks surprising traders.
Thus whether the Fed hikes or cuts isn’t usually what moves gold, those decisions are already priced in leading into FOMC meetings. It is several other things accompanying Fed decisions that interact with the collective expectations of gold-futures speculators that determine how gold will react. These are FOMC statements, so-called dot plots, and the Fed chairman’s press conferences now following each decision.
FOMC statements are what detail policy decisions, a few paragraphs released at 2pm. They explain what the Fed is seeing in the US economy, whether it decided to change anything, and whether it is likely to act in coming months. They also detail which of the 10 active FOMC members voted for or against what the committee decided to do. Usually little changes in FOMC statements between meetings, they seldom surprise.
The big changes come in the dot plots, what traders call a particular chart in an accompanying document called the Summary of Economic Projections. SEPs are only published at every-other FOMC meeting, so once a quarter. These are the Fed decisions near calendar quarter-ends. Dot plots chart where every individual top Fed official expects the federal-funds rate to be this year and in each of the coming several years.
These dot plots are never accurate forecasts, the Fed governors and presidents are constantly changing their minds. Top Fed officials often try to downplay the dot plot, warning it is not an official FOMC outlook but just summarized individual opinions. Nevertheless the dot plots are highly anticipated by traders, and are what they use to decide whether the FOMC is trending more hawkish or dovish than they expected.
Most of the times gold moves significantly either way on Fed decisions, it is due to the dot plot implying more or less rate hikes or cuts than traders were looking for at the time. More hikes or fewer cuts are hawkish, boosting the US dollar which leads gold-futures speculators to sell. Fewer hikes or more cuts are dovish, hitting the dollar which sparks gold-futures buying. The dot plot is where most of the action is!
The dot plot is released right at 2pm at every-other FOMC decision. The Fed chairman used to hold a press conference after every-other meeting too, on that dot-plot schedule. But in June 2018, the current Fed chairman Jerome Powell announced he’d start talking to reporters and taking their questions after every FOMC decision from January 2019 on. These press conferences are televised live starting at 2:30pm.
Traders carefully listen to what Fed heads say, parsing whether they appear more or less hawkish or dovish than expected. So though it’s rarer than dot-plot spawned gold-futures trading, gold can move big on what Fed chairmen are saying. The particular thing often goading speculators into buying or selling are apparent changes in the Fed’s future rate trajectory. Watching all this unfold in real-time is fascinating.
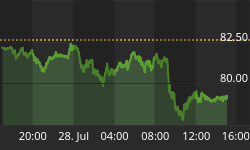
Gold rallied back up to $1509 heading into this Wednesday’s FOMC decision. That wasn’t because gold-futures speculators were looking for a universally-forecast rate cut, but since they figured the Fed would imply still more cuts coming in the months ahead. Gold plunged from $1509 just before 2pm to $1484 about 50 minutes later, that sharp 1.7% intraday drop, because of what the newest quarterly dot plot revealed. Related: Beijing Backlash: Stocks Slammed, Gold Boosted
The prior one released in mid-June was a major shift from a tightening bias to an easing one. At that point the top Fed officials’ 2019 outlook for the federal-funds rate stayed neutral, but their 2020 one shifted from a single additional hike next year to one cut. That heralded the end of the latest rate-hiking cycle, and the dawn of a new rate-cutting one. Then in late July between dot plots the FOMC made that initial cut.
Since the FOMC had gone from no FFR changes in 2019 to cutting at its very next meeting in late July, and was universally expected to cut again this week, traders figured this week’s newest dot plot would start to show more cuts coming. But they were disappointed, as the Fed officials’ 2019 outlooks averaged together left the FFR at the same 1.88% it was set to at this meeting. There were no more cuts implied in 2020 either.
It was that hawkish surprise that goosed the US dollar and hammered gold, no more rate cuts implied this year or next. It was close though, with 7 of 17 top Fed officials seeing one more cut appropriate later this year. If not for that narrow minority, gold would’ve plunged much further. About an hour later during Powell’s press conference, gold was rescued and rebounded somewhat to a relatively-minor 0.6% daily loss.
In answering a reporter’s question, he declared “it is certainly possible that we will need to resume the organic growth of the balance sheet earlier than we thought.” That was a hint the FOMC is considering restarting quantitative easing, conjuring money out of thin air to buy up bonds! The prospects of QE4 are what mitigated that dot-plot-hawkish-surprise gold selloff, and reversed the stock markets higher as well.
So gold’s reaction to FOMC decisions may seem random, but it’s usually fairly logical. If the Fed is more hawkish or dovish than gold-futures speculators expected, then gold is going to move accordingly. And that is usually determined based on the quarterly dot plot, although Powell’s pressers are growing in importance since they now happen after every FOMC meeting. The Fed’s gold-bull impact can be gamed.
This first chart superimposes this current gold bull over the federal-funds rate since early 2016, just after gold resumed powering higher. Every FOMC rate hike and cut in that span is noted, and whether the dot plot that accompanied it was more hawkish than traders expected, more dovish, or neutral. Gold reacted accordingly, and will behave similarly around future FOMC decisions based on how they match expectations.

(Click to enlarge)
Way back in December 2008 during that first stock panic in a century, the FOMC panicked too slamming the FFR to zero. That fateful zero-interest-rate-policy day, the Fed changed its hard FFR target to a quarter-point range. Thus all FFR levels since are an average of the range’s top and bottom. This week for example, the FOMC cut to a 1.75%-to-2.00% range. The midpoint of that is 1.88%, which is shown here.
During the panic, the FOMC had advertised ZIRP as a temporary crisis measure. But long after that crisis passed and stock markets soared into a powerful new bull, Fed officials lacked the courage to normalize rates. So for 7.0 years continuously, the federal-funds rate ran at 0.13%. The FOMC finally hiked again in mid-December 2015, which was its first rate hike in 9.5 years. That whole episode greatly affected gold.
In late October 2015, gold was trading near $1182 heading into a 2pm FOMC decision. Its statement had a sentence declaring “In determining whether it will be appropriate to raise the target range at its next meeting...” Those last 4 words were new, and gold-futures traders fled on the prospect of the first rate hike in nearly a decade in just 7 weeks. Gold plunged 8.4% over the next several weeks on heavy selling.
The Friday before that first rate-hiking decision, I published a study on how gold fared in rate-hike cycles historically. Contrary to popular worries, it had averaged strong 26.9% rallies during the exact spans of the 11 previous Fed-rate-hike cycles! So a new hiking cycle would actually prove quite bullish for gold. Still gold plunged 2.1% to a dismal 6.1-year secular low the day after the FOMC finally lifted rates out of ZIRP.
Though that final swoon birthed the gold bull since, it was actually a hawkish dot plot that spawned that immediate gold-futures selling. Heading into that mid-December-2015 FOMC decision, traders were looking for 3 more rate hikes forecast in 2016. But top Fed officials collectively saw 4 rate hikes that year, kicking off the last hurrah of bear-market gold-futures selling. That dot plot, not the hike, is what surprised traders.
Gold soared 29.9% higher over the next 6.7 months in this bull’s mighty maiden upleg, stalling out around $1350 upper resistance. It was correcting normally until Trump’s unexpected election victory later that year. Hopes for big tax cuts soon from the new Republican-controlled government unleashed a major stock-market rally, which motivated gold-futures speculators to sell with reckless abandon. Gold cratered.
By mid-December 2016 its correction had cascaded to a monster 17.3% over 5.3 months! Though that was shy of the -20% new-bear threshold so gold’s bull was still intact, few believed it at the time. After waiting an entire year, the timid FOMC finally hiked a second time confirming a rate-hike cycle was underway. Again gold bottomed the very next day, after briefly selling off again on another hawkish dot plot.
Top Fed officials were collectively expecting 3 more rate hikes in 2017, up from 2 in the previous dot plot a quarter earlier. Gold dropped 1.2% that day on that unexpected hawkishness, but then started climbing higher in a 20.4% upleg that would last 13.3 months. The next 3 rate hikes of that young hiking cycle didn’t sink that upleg. Rate hikes and cuts on their own aren’t necessarily bullish or bearish for gold! Related: Supply Concerns Halt Expansion On Tianqi Lithium Plant
The FOMC’s 3rd rate hike came a quarter later in mid-March 2017. At that point the Fed-chairman press conferences only came after every-other meeting, so no rate decisions were made at the off meetings as they couldn’t be explained afterwards to calm anxious traders. That dot plot was actually dovish, as top Fed officials’ speeches leading into that decision left traders expecting another hike would be added in.
Yet that dot plot came in unchanged from the prior one, still implying 3 total rate hikes in 2017. That less-hawkish-than-expected-and-therefore-dovish dot plot ignited a 5.6% gold surge over the next 5 weeks or so. The FOMC’s 4th rate cut a quarter later in mid-June 2017 was accompanied by a neutral dot plot, the Fed was still signaling 3 total hikes in 2017. But gold fell 3.8% over the next few weeks for another reason.
It was that FOMC meeting where the Fed warned it was going to start unwinding the staggering $3625b of money printing it had done over 6.7 years through several QE campaigns. Quantitative tightening was erroneously seen as a threat to gold then. But gold soon rallied out of the summer doldrums before the Fed hiked the 5th time mid-December 2017. With another neutral dot plot, gold rallied sharply out of lows.
The top Fed officials’ collective rate forecast stayed unchanged from the prior dot plot, implying 3 more rate hikes in 2018. Due to Fedspeak and market developments, gold-futures speculators had expected that to rise to 4. So that neutral dot plot was still effectively a dovish surprise, kicking off another sizable gold rally. See the pattern here? Gold sells off on dot plots perceived as hawkish, and rallies on dovish ones.
The FOMC’s 6th rate hike of that latest tightening cycle came a quarter later in late March 2018. That was another neutral dot plot, not budging from the prior couple’s forecast of 3 total rate hikes that year. So gold drifted sideways after that before rolling over into a healthy bull-market correction. Gold was stabilizing near its 200-day moving average until the Fed’s 7th rate hike another quarter later in mid-June 2018.
Yet again that rate hike was well-telegraphed in advance and fully priced in in federal-funds futures, so it was no surprise. But the dot plot waxed considerably more hawkish, with top Fed officials’ outlook for the FFR climbing to 4 total hikes in 2018 instead of the previous 3. That ignited sizable gold-futures selling, which soon snowballed into the most-extreme gold-futures short selling ever witnessed hammering gold!
While gold-futures-trading momentum can take on a life of its own, FOMC surprises which usually come in the dot plot can kick off these short-term trends. The Fed’s 8th hike came the following quarter with the next dot plot in late September 2018. Gold was pretty stable after that one as the dot plot again came in neutral, with 4 total rate hikes expected in 2018, 3 more in 2019, and a single final one way out in 2020.
A new gold upleg driven by gold-futures buying to normalize speculators’ excessively-bearish bets was well underway by the Fed’s 9th hike in mid-December 2018. Again that hike was universally expected, but the dot plot came in dovish. The rate-hike forecast for 2019 and 2020 moderated from 4 more hikes to 3. The resulting gold rally was greatly boosted by a sharp plunge in stock markets after that particular dot plot.
How traders view dot plots is always dependent on what they expected going in. Stock traders were way more dovish than gold-futures speculators heading into that one, as stock markets had really weakened on hawkish Fedspeak in previous months. Stock traders expected Fed officials to strike 3 of the future hikes, leaving just 1. When they only got a third of that, US stock markets plunged. That carnage boosted gold.
By late December last year, the flagship US S&P 500 stock index had plummeted 19.8% to the edge of new-bear territory in just 3.1 months! The final third of that collapse came in 4 trading days after that dot plot came in not-dovish-enough for stock traders. Fed officials are terrified of sparking a stock-market selloff that damages confidence spawning a recession, so they reversed course hard this year to goose stocks.
The FOMC paused its rate-hiking cycle, and at its late-March-2019 meeting Fed officials slashed their rate-hike outlook. The dot plot went from showing 2 more rate hikes in 2019 to zero this year, leaving a single final one out in 2020. But since that was expected, it wasn’t really a dovish surprise so gold didn’t move much. But the next dot plot a quarter later changed everything for gold, launching a huge breakout.
Despite still being in a bull market technically, few believed gold was. It hadn’t made a new bull high in 2.9 years, and was trapped under seemingly-impregnable $1350 upper resistance. It was the mid-June-2019 FOMC meeting’s dot plot that finally catapulted gold to a long-overdue decisive bull-market breakout from there! That dot plot left 2019 neutral with no hikes nor cuts, but replaced 2020’s lone hike with one cut.
Fed officials’ outlooks were officially shifting from tightening to easing mode, a radical reversal compared to how they felt just a half-year earlier at their 9th hike. That later proved the end of that hiking cycle, 9 hikes for 225 basis points over 3.0 years. Gold fared well in its exact span, rallying 17.0%. FOMC rate hikes were never a threat for gold, despite what traders feared before that tightening cycle first started.
At the FOMC’s next meeting in late July 2019 between dot plots, the Fed cut its federal-funds rate for the first time in 10.6 years! That too was expected, and gold actually fell during the Fed chairman’s press conference when he declared that cut was a “midcycle adjustment” and not “the beginning of a lengthy cutting cycle”. But gold resumed powering higher the next day on totally-unrelated US-China trade-war news.
This gold bull’s history surrounding FOMC decisions is clear, the gold-price reactions generally aren’t unpredictable. They can be gamed with the knowledge of where Fed officials were on their rate outlook in the previous dot plot, what gold-futures speculators expect, and whether the imminent dot plot is likely to show more or less hikes or cuts. Gold generally surges on dovish surprises, and sells off on hawkish ones.
There’s one more key factor to consider heading into FOMC meetings, how gold-futures speculators are positioned. This last chart is updated from last week’s essay where I explained why gold’s current short-term outlook is bearish due to a massive gold-futures-selling overhang. When speculators are almost all-in longs and all-out shorts, their buying is exhausted. All they can do is sell, regardless of what the Fed does.

(Click to enlarge)
Heading into this week’s latest FOMC meeting, total spec longs and shorts were running 83% and 7% up into their bull-market trading ranges. That was uncomfortably close to the most-bearish-possible near-term gold setup of 100% longs and 0% shorts. So material gold-futures selling was likely anyway, and just exacerbated by that newest dot plot not being as dovish as expected in coming-Fed-rate-cut terms.
It is incredibly troubling and damning how much influence the Federal Reserve holds over markets. How top Fed officials communicate really bullies gold, currencies, and stock markets around. That makes it absolutely essential to follow the FOMC. Once every 6 weeks, all speculators and investors need to get up to speed with the prior meeting. They also need to check in on how gold-futures speculators are betting.
Armed with that knowledge, gold’s likely reaction after any given FOMC decision can be gamed. Gold’s reactions are logical, and based on whether either the FOMC statement, dot plot if released, and things the Fed chairman says at his press conference are more dovish or more hawkish than expected. As long as Fed rate expectations dominate short-term market action, traders are stuck having to watch the Fed.
The bottom line is Fed actions have really impacted this gold bull, and will continue to do so. This isn’t from the rate hikes or cuts themselves, which are well-telegraphed and universally expected in advance. Markets move based on changes implied in the outlook for the future rate trajectory. That can spawn big buying and selling in gold futures, leading to large and fast gold-price moves following FOMC decisions.
These rate-outlook shifts usually come in Fed officials’ collective forecasts summarized in the dot plots, but are sometimes seen in the Fed chairman’s press conferences. Gold tends to surge if the Fed looks more dovish than expected, and sell off if it comes across as more hawkish. This is due to the reactions from the gold-price-dominating gold-futures speculators. Their positioning also impacts how they react to the FOMC.
By Adam Hamilton
More Top Reads From Safehaven.com:


