 |
Gold •584 days | 2,368.70 | +35.30 | +1.51% |
 |
Platinum •15 mins | 2,099.40 | +28.80 | +1.39% |
 |
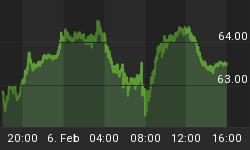
WTI Crude •1 day | 63.55 | +0.26 | +0.41% |
 |
Gasoline •1 day | 1.953 | +0.027 | +1.38% |
 |
Ethanol •584 days | 2.161 | +0.000 | +0.00% |
 |
Silver •584 days | 30.82 | +1.16 | +3.92% |
 |
Silver • 584 days | 30.82 | +1.16 | +3.92% | |
 |
Copper • 584 days | 4.530 | +0.111 | +2.51% | |
 |
Brent Crude • 1 day | 68.05 | +0.50 | +0.74% | |
 |
Natural Gas • 1 day | 3.422 | -0.087 | -2.48% | |
 |
Heating Oil • 1 day | 2.413 | +0.020 | +0.84% |

Bill McLaren
Contributor since: 26 Feb 2010
-
CNBC Squawkbox Europe
LET'S LOOK AT THE S&P 500 INDEX Two weeks ago I laid out the time windows for this correction and the price support. One of…
-
CNBC Squawkbox Europe
LET'S LOOK AT THE S&P 500 DAILY CHART The key time period now is the one year cycle from the March low. After significant bear…
-
CNBC Squawkbox Europe
LET'S LOOK AT THE S&P 500 DAILY CHART This has been a frustrating three weeks with the index trading within the same small range and…
-
CNBC Squawkbox Europe
October 9, 2009 LET'S LOOK AT THE S&P 500 INDEX DAILY CHART Two weeks ago I indicated the selloff would stop around 1027 and it…
-
Squawkbox Europe
September 25, 2009 LET'S LOOK AT THE S&P 500 DAILY CHART The high two days ago showed a little "false break" pattern for top, there…
-
CNBC Squawkbox Europe
LET'S LOOK AT THE S&P 500 INDEX DAILY CHART Let me start off by saying picking tops and bottoms to high momentum moves is the…
-
CNBC Squawk Europe
LET'S LOOK AT THE S&P 500 INDEX DAILY CHART Two weeks ago on Squawk box I indicated there were only two alternatives for the index.…
-
Squawkbox Europe
LET'S LOOK AT THE S&P 500 DAILY CHART The index has rallied one day followed by 4 days of struggling upward and now a wide…
-
Squawk Box Europe
LET'S LOOK AT THE S&P 500 INDEX DAILY CHART Last appearance on SQUAWK BOX was June 5th and I indicated in this circumstance we could…
-
Squawk Box Europe
LET'S LOOK AT THE S&P 500 INDEX - DAILY CHART Two weeks ago I indicated the index was going up into the 90 day time…
-
CNBC Squawkbox Europe
FIRST LET'S LOOK AT THE S&P 500 DAILY CHART The past four weeks the index has been struggling upward as each instance it breaks to…
-
CNBC Squawkbox Europe
LET'S LOOK AT THE S&P 500 INDEX Two weeks ago on Squawk Box I said stocks looked good and the index would rally 12 trading…
-
CNBC Europe Squawk Box
LET'S LOOK AT THE S&P 500 INDEX DAILY CHART This is a picture of the sideways move since the November low. The last time I…
-
CNBC Squawkbox Europe
LET'S LOOK AT THE S&P 500 DAILY CHART Back in December I put this chart up on CNBC and said this was the price and…
-
CNBC Report
First let's look at a few charts that are quite interesting. THE FIRST CHART IS MONTHLY FOR THE DOW 1929 THROUGH 1942 The vertical lines…
-
CNBC Squawkbox Europe
January 16 2009 LET'S LOOK AT THE S&P 500 DAILY CHART Last time I was on Squawk Box was January 2nd and I put this…
-
CNBC SquawkBox Europe
October 10, 2008 The last time on CNBC was October 1st and I said it didn't matter if the bail out bill was passed or…
-
CNBC PowerLunch Europe
October 01, 2008 LET'S LOOK AT THE S&P 500 DAILY CHART This is a picture of the trading since the July low. Notice during this…
-
CNBC SquawkBox Europe
LET'S LOOK AT THE S&P 500 INDEX CHART AND A FEW PROBABILITIES Has there been a climax of bad news yet? There has been the…
-
CNBC PowerLunch Europe
September 3, 2008 LET'S LOOK AT THE S&P 500 DAILY CHART Last week I though the index could start the move up to the 1340…


