 |
Gold •584 days | 2,368.70 | +35.30 | +1.51% |
 |
Platinum •10 mins | 2,099.40 | +28.80 | +1.39% |
 |
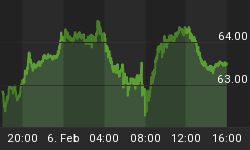
WTI Crude •1 day | 63.55 | +0.26 | +0.41% |
 |
Gasoline •1 day | 1.953 | +0.027 | +1.38% |
 |
Ethanol •584 days | 2.161 | +0.000 | +0.00% |
 |
Silver •584 days | 30.82 | +1.16 | +3.92% |
 |
Silver • 584 days | 30.82 | +1.16 | +3.92% | |
 |
Copper • 584 days | 4.530 | +0.111 | +2.51% | |
 |
Brent Crude • 1 day | 68.05 | +0.50 | +0.74% | |
 |
Natural Gas • 1 day | 3.422 | -0.087 | -2.48% | |
 |
Heating Oil • 1 day | 2.413 | +0.020 | +0.84% |

Rajveer Rawlin
Contributor since: 11 Jan 2015
Biography
Rajveer Rawlin received his MBA in finance from the Cardiff Metropolitan University, Wales, UK. He is an avid market watcher having followed capital markets in the US and India since 1993. His research interests includes areas of Capital Markets, Banking, Investment Analysis and Portfolio Management and has over 20 years of experience in the above areas covering the US and Indian Markets. He has several publications in the above areas. The views expressed here are his own and should not be construed as advice to buy or sell securities.
-
The Case for a Global Recession in 2016 and Beyond - The Obvious Evidence
Definition of a Recession: The textbook definition of a recession is two quarters of negative GDP growth. Some examples of recessions include the great depression…
-
A Comparison of Current US Stock Market Performance to that in 2008 and 2000
A look back at stock market performance in two major bear market years of 2000 & 2008 reveals some interesting findings: First lets look at…
-
SP500, Lots of Downside Ahead, Major Tops and Bottoms Analysis since 1950
With the recent melt down in global markets, it would be prudent to look back at historical data on the US market to see where…
-
Some Bear Market ETF's to Consider for September and Beyond
The US and global markets appear stretched both on a technical and fundamental basis. A correction is looming and is likely to be significant this…
-
Some Compelling Reasons Why the Next Move Down in Global Markets is Just Around the Corner
There are some compelling reasons to believe that the next move down in risk assets across the globe is about to begin: First and foremost…
-
Why I am Bearish Long Term on the Nifty?
First and foremost the Nifty is way overvalued at current levels with a trailing P/E in excess of 23. Have a look at Sanjay Jaiswal's…
-
Why I am Ultra Bearish over The Long Term
Some interesting developments are playing out in long term charts that make me feel comprehensively bearish over the long term: a) Firstly a massive rising…
-
Stock Market Signals for the US and Indian Stock Markets for the Upcoming Week beginning May 25
Indicator Weekly Level / Change / Significance Implication for S&P 500 Implication for Nifty* S & P 500 2126, 0.16% Neutral** Neutral Nifty 8459, 2.38% Neutral Bullish…
-
Grexit or No Grexit, Get Ready for The Next Big Move in The Market
It is increasingly looking like a Greek IMF default is on the cards. Regardless some key markets are poised for big moves. Let us take…
-
Stock Market Signals for The US and Indian Stock Markets for The Upcoming Week Beginning May18
Indicator Weekly Level / Change / Significance Implication for S&P 500 Implication for Nifty* S&P 500 2123, 0.31% Neutral** Neutral Nifty 8262, 0.90% Neutral Bullish China Shanghai…
-
Weekly Stock Market Signals for The US and Indian Stock Markets for The Upcoming Week Beginning May 11
Indicator Weekly Level / Change / Significance Implication for S&P 500 Implication for Nifty* S&P 500 2116, 0.40% Neutral** Neutral Nifty 8192, 0.10% Neutral Neutral China Shanghai…
-
Weekly Stock Market Signals
Indicator Weekly Change / Significance Implication for S&P 500 Implication for Nifty* S & P 500 -0.40% Bearish Bearish Nifty -1.50% Neutral Bearish Gold -0.20%…
-
Is the Fed about to Ignite the Sell in May and Go Away Trade?
First and foremost most fed meetings are positive for the stock market. The fed usually gives the market what it wants and the markets keep…
-
Option Strategy to Capture The Next Big Move in The Market
It appears that volatility will be the name of the game going forward. The Vix appears to be headed upwards in the short term. If…
-
Behind the Tantrums of QE Withdrawal Lies a Very Grave Deflationary Threat
Last week most risk assets sold of on the prospects of QE withdrawal following strong job numbers out of the U.S. Here's how things shaped…
-
Warning Signs for Risk Assets in 2015
There are two major warning signs that are developing for risk assets in 2015: First we have significant dollar strength, with the dollar index hitting…
-
Bear Market Lessons from History
While the financial media is absolutely infatuated with stocks hitting new highs everyday, we would do well to pay attention to some ongoing bear markets:…
-
Predictions for 2015
Dollar strength continues after a brief pause against all major currencies except the yen. With the Euro decisively breaking the long term support of 1.20.…


