 |
Gold •584 days | 2,368.70 | +35.30 | +1.51% |
 |
Platinum •10 mins | 2,099.40 | +28.80 | +1.39% |
 |
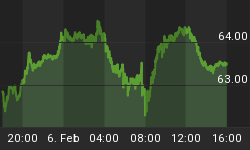
WTI Crude •1 day | 63.55 | +0.26 | +0.41% |
 |
Gasoline •1 day | 1.953 | +0.027 | +1.38% |
 |
Ethanol •584 days | 2.161 | +0.000 | +0.00% |
 |
Silver •584 days | 30.82 | +1.16 | +3.92% |
 |
Silver • 584 days | 30.82 | +1.16 | +3.92% | |
 |
Copper • 584 days | 4.530 | +0.111 | +2.51% | |
 |
Brent Crude • 24 hours | 68.05 | +0.50 | +0.74% | |
 |
Natural Gas • 1 day | 3.422 | -0.087 | -2.48% | |
 |
Heating Oil • 1 day | 2.413 | +0.020 | +0.84% |

TheWaveTrading
Contributor since: 25 Sep 2011
Biography
My goal is to establish the most likely path that the price of a particular asset will undertake and profit through ETF instruments both on the long and short side and mainly with leveraged ones (2 x and 3 x).
-
UPRO: Bullish Setup
Entry Date: 05/29/2014; Long 100.37; Stop: 98.35; Target: 107.90 +/- Reason: Price should have completed a Triangle In my last update of SPX on May…
-
SPX: Follow Up of The Ending Diagonal Pattern
I maintain as a probable scenario that price from the October 2013 low is forming an Ending Diagonal, in which case SPX is now involved…
-
GOOGL: Bullish Watchlist
Reason: Potential Morning Doji Star reversal pattern after a successful test at the 200 dma. The Morning Doji Star candlestick bullish reversal pattern should be…
-
IBB (Nasdaq Biotechnology ETF): Bullish Setup Watchlist
Reason: Potential Inverted Head & Shoulder with a theoretical target located at 265 Larger Image The right shoulder is still under construction but, as it…
-
IBEX: The Ending Diagonal
The Triangle scenario that I posted on March 25 has not panned out instead, in my humble opinion, from the December low price has formed…
-
Tesla: Bullish Setup
Reason: Potential Inverted Head & Shoulder If Tuesday's lod holds price could be forming an IHS with a theoretical target at 255. Larger Image Even…
-
DRV (Real Estate Bear 3x ETF): IWR Bearish Watchlist
Reason: Potential Bullish Falling Wedge This is a short-term trade setup. If the Bullish Falling Wedge pans out it should result in a sharp rebound…
-
NDX: The Decline is Jeopardizing a Bullish Outcome
NDX is approaching the February low. As discussed in weekly update on April 6, this area is a twofold critical since it coincides with the…
-
SPX: Are We Almost Done With The Downside?
Before analysing the Elliott Wave pattern lets review some technical indicators because in my opinion we are getting close to extreme readings that usually should…
-
EURUSD: The Ending Diagonal Option
Brief update: On March 16, in my last review of the long-term Elliott Wave Pattern I discussed three potential scenarios for the advance from the…
-
SDOW (3xShort Dow ETF): Bullish Watchlist
Reason: Potential Inverted Head & Shoulder with theoretical target at 33. In the daily chart below we can see that price has formed a likely…
-
Weekly Technical/Elliott Wave Analysis (SPX, DJIA, NDX)
Don't Count your Chickens Before they're Hatched We have a very aged bullish trend but in my opinion we don't have yet a confirmation that…
-
GLD: Bullish Watchlist (Short-Term Time Frame)
This idea is extremely aggressive since the stop is a bit far away and initially the expected profit is the 1 x 1 extension target…
-
IBB (NASDAQ Biotechnology ETF): Bullish Watch List
IBB has suffered a serious selloff. I don't know if a major top is in place although the weekly MACD bearish cross does not inspire…
-
SPX: The Corrective Pattern Remains Unsolved
A Diverging Market If all things were equal as we can see in the weekly chart of SPX below there would be no indication whatsoever…
-
NUGT: Bullish Setup Watch List
Reason: Potential tradable bottom. There is no confirmation yet of at least a short-term bottom but Thursday's large black hollow candlestick (Almost a Marubozu) is…
-
IBEX: The Next to The Last Elliott Wave Pattern?
Brief update: A Triangle always precedes the final up leg of an Elliott Wave Pattern. The thrust following the contracting pattern ends a move. It…
-
SPX: Will It Confirm The Double Top?
My son is playing a tennis tournament so I don't have much time for the weekly update. I will just iterate the already discussed potential…
-
EWW: Bullish Setup
I have no idea regarding the long-term Elliott Wave Patter, but it does not matter since this is a short-term bullish setup Reason: Completed a…
-
EURUSD: Review of The Long Term Elliott Wave Pattern
Brief update I maintain the two potential patterns discussed the last time on October 19, 2013: Double Zig Zag Option: From the July 2012 low…


