 |
Gold •583 days | 2,368.70 | +35.30 | +1.51% |
 |
Platinum •15 mins | 2,099.40 | +28.80 | +1.39% |
 |
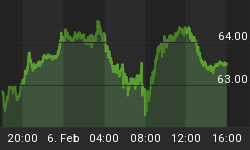
WTI Crude •12 hours | 63.55 | +0.26 | +0.41% |
 |
Gasoline •12 hours | 1.953 | +0.027 | +1.38% |
 |
Ethanol •583 days | 2.161 | +0.000 | +0.00% |
 |
Silver •583 days | 30.82 | +1.16 | +3.92% |
 |
Silver • 583 days | 30.82 | +1.16 | +3.92% | |
 |
Copper • 583 days | 4.530 | +0.111 | +2.51% | |
 |
Brent Crude • 11 hours | 68.05 | +0.50 | +0.74% | |
 |
Natural Gas • 12 hours | 3.422 | -0.087 | -2.48% | |
 |
Heating Oil • 12 hours | 2.413 | +0.020 | +0.84% |

Guy Lerner
Contributor since: 26 Feb 2010
Biography
Guy M. Lerner is the editor and founder of The Technical Take blog.
-
Inflation Pressures Remain
Whether real or perceived, inflationary pressures are a headwind for equities. Data out this week shows year over year changes in both CPI and PPI…
-
The 4 C's And 1 B
I came across this quote from Professor Mark J. Perry of the Carpe Diem blog. I have often thought similar things. Dr. Perry writes: "Bottom…
-
How Will We Know The Secular Trend Change In 10 Year Treasury Yields Is For Real?
I am on record stating that yields on the 10 year Treasury bond will move higher over the next 12 months, and this will represent…
-
Investor Sentiment: You Have To Believe
The "Dumb Money" indicator is shown in figure 1. The "Dumb Money" indicator looks for extremes in the data from 4 different groups of investors…
-
Anatomy Of A Top
One of the major themes that I have been highlighting on this blog since its inception 6 months ago is the potential for a secular…
-
The LEI, SP500, And 10 Month Moving Average
Over the past month I have highlighted the strategy attributed to Mebane Faber. It is a simple but elegant strategy that probably gets more merit…
-
EWJ And The USDJPY
I would like to explore the relationship between the i-Shares MSCI Japan Index Fund (symbol: EWJ) and the US Dollar Japanese Yen (symbol: USDJPY) cross…
-
Question: What Does The Bullish Signal From The Coppock Guide Mean? Answer: Absolutely Nothing!
I am seeing several articles in the main stream press and blogosphere regarding the "bullish signal" given by a technical indicator known as the Coppock…
-
Investor Sentiment: Intent On Crushing The Bears
There is no meaningful difference in the "Dumb Money" and "Smart Money" indicators from last week. The "dumb money" is extremely bullish, and their persistence…
-
5 Reasons To Be Bullish On Gold
Before getting to our analysis, let me first state that I hate snappy titles like the one I have used for this article. You know,…
-
10 Year Treasury Yields: Price Action Confirms Secular Trend Change
A monthly close over 3.432% confirms the secular trend change in the 10 year Treasury bond that I have been expecting and writing about for…
-
Investor Sentiment: A Widening Divergence
For the US equities market, we see a widening divergence between the "Smart Money" and the "Dumb Money" indicators. The "dumb money" has maintained its…
-
Inflation Expectations To Pressure Equities
This is a headwind for equities that has started to pop up over the past couple of weeks. Yet, it has taken years to ferment…
-
Gold: Still On The Launching Pad
I last wrote about gold on April 30, 2009. In that article, I stated that gold was on the launching pad. Something big was going…
-
Barron's Weighs In On Treasury Yields (Again!)
This is the second cover story in 5 months for Barron's on the bursting of the bubble in Treasury yields. I have been closely following…
-
Investor Sentiment: Is More Bulls A Good Thing?
Although the S&P500 lost 4.9% for the week, the bullish contingent actually grew stronger. This can be seen in the "Dumb Money" indicator shown in…
-
More Headwinds To Worry About
On the way into the office this morning, I was listening to CNBC radio on Sirius Satellite. In that 7 minute drive, I think I…
-
Investor Sentiment: It Takes Bulls To Make A Bull Market
The "Dumb Money" indicator now shows that there are too many bulls. From a contrarian perspective, one would think that this is bearish for prices…
-
Bursting Of The Bond Bubble: Not So Fast
The yield on the 10 year Treasury bond has spiked 10% in the past two weeks, and many are now jumping on the "bonds are…
-
Bear Market Rally Or New Bull?
Since the equity markets bottomed on March 9, I have always been very careful to point out that the current rally is a bear market…


