 |
Gold •583 days | 2,368.70 | +35.30 | +1.51% |
 |
Platinum •14 mins | 2,099.40 | +28.80 | +1.39% |
 |
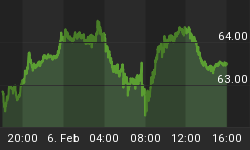
WTI Crude •11 hours | 63.55 | +0.26 | +0.41% |
 |
Gasoline •11 hours | 1.953 | +0.027 | +1.38% |
 |
Ethanol •583 days | 2.161 | +0.000 | +0.00% |
 |
Silver •583 days | 30.82 | +1.16 | +3.92% |
 |
Silver • 583 days | 30.82 | +1.16 | +3.92% | |
 |
Copper • 583 days | 4.530 | +0.111 | +2.51% | |
 |
Brent Crude • 10 hours | 68.05 | +0.50 | +0.74% | |
 |
Natural Gas • 11 hours | 3.422 | -0.087 | -2.48% | |
 |
Heating Oil • 11 hours | 2.413 | +0.020 | +0.84% |

Guy Lerner
Contributor since: 26 Feb 2010
Biography
Guy M. Lerner is the editor and founder of The Technical Take blog.
-
Composite Sentiment Indicator
Figure 1 shows a weekly chart of the SP500 with the composite sentiment indicator. This indicator is constructed from 10 different variables that assess investor…
-
Investor Sentiment: What is the Significance?
As expected, the bearish extremes in sentiment have resolved or are resolving into a more neutral investor stance as prices in the equity markets have…
-
Gold Miners: This is a Great Set - Up
Figure 1 shows a weekly chart of the Market Vectors Gold Miners ETF (symbol: GDX). Figure 1. GDX/ weekly The pink and black dots represent…
-
Why October, 2011 isn't August, 2010
I often get the feeling that traders and investors have put too great a trust in the monetary magic of the Federal Reserve. It's August,…
-
Are Bonds Still Attractive?
My bond model has been positive since March 11, 2011, and this move in bonds has been at odds to what other market mavens (Pimco's…
-
Investor Sentiment: Buy the Dip
Last week's bullish "call" was good if not obscene. I know we want and expect the NASDAQ100 to go up 7% every week, but somehow…
-
Don't Forget About the Dollar
Figure 1 is a weekly chart of the Dollar Index. Figure 1. Dollar Index/ weekly The strength of a month ago has given way to…
-
Is the US Economy in a Recession?
The National Bureau of Economic Research is the official arbiter of economic expansions and contractions. Their official recession calls tend to be after the fact,…
-
Performance of SP500 in Recessions
The National Bureau of Economic Research has yet to declare that the US economy is in a recession, but they are usually late in making…
-
Where is the 'R' Word?
I don't hear the "R" word mentioned much these days. The "R" word isn't for "resilient" as in "gee Bob (Pisani), the stock market is…
-
Bullish Dollar v. SP500
Figure 1 shows a weekly chart of the SP500. The price bars marked in red are those times when our Dollar model (see this article)…
-
Investor Sentiment: This is Bullish Because...
The current set up is bullish not because investor sentiment remains extremely bearish, but because prices have closed above a key pivot level. For the…
-
Bullish Dollar is Good for Gold
Figure 1 shows a weekly chart of gold (cash data). The price bars marked in red are those times when our Dollar model (see this…
-
Dollar Index: Bullish
The last time I looked at the Dollar Index was on September 2, 2011, and I made the statement: "The Dollar Index is making an…
-
Investor Sentiment: This is How I Roll
As expected investor sentiment remains extremely bearish. Typically, these are bull signals, or rather that is how it works out about 80% of the time.…
-
Oil: Breaking Down
Figure 1 is a weekly chart of the i-Path Goldman Sachs Crude ETN (symbol: OIL). Figure 1. OIL/ weekly Simply put OIL has broken down.…
-
It is Time to Put Up or Shut Up
It is time for the market to put up or shut up! Many of the indicators that I look at suggest that the markets are…
-
GDX: Mixed
What a difference a week makes. On September 16, I was bullish on the Market Vectors Gold Miners ETF (symbol: GDX). As you can see…
-
SLV: Toast
Figure 1 is a weekly chart of the i-Shares Silver Trust (symbol: SLV). Figure 1. SLV/ weekly With a close below two key pivot levels,…
-
Gold: Fundamentals Remain Strong
Despite last week's drubbing, the fundamentals for gold remain particularly favorable. Gold has fallen about 17% from its highs, and most of the drop occurred…


