 |
Gold •584 days | 2,368.70 | +35.30 | +1.51% |
 |
Platinum •14 mins | 2,099.40 | +28.80 | +1.39% |
 |
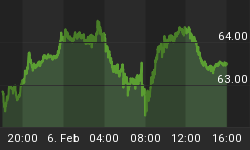
WTI Crude •1 day | 63.55 | +0.26 | +0.41% |
 |
Gasoline •1 day | 1.953 | +0.027 | +1.38% |
 |
Ethanol •584 days | 2.161 | +0.000 | +0.00% |
 |
Silver •584 days | 30.82 | +1.16 | +3.92% |
 |
Silver • 584 days | 30.82 | +1.16 | +3.92% | |
 |
Copper • 584 days | 4.530 | +0.111 | +2.51% | |
 |
Brent Crude • 1 day | 68.05 | +0.50 | +0.74% | |
 |
Natural Gas • 1 day | 3.422 | -0.087 | -2.48% | |
 |
Heating Oil • 1 day | 2.413 | +0.020 | +0.84% |

Mike Paulenoff
Contributor since: 26 Feb 2010
Biography
Mike Paulenoff is author of the MPTrader.com, a real-time diary of his technical analysis and trading alerts on ETFs covering metals, energy, equity indices, currencies, Treasuries, and specific industries and international regions.
-
Climb in Yields Could Benefit Equities, though Flight to Commodities Continues
Interesting that the TLT's (Lehman 20 year T-bond ETF) fell 1.4% on Friday, which reflects a climb in 10-year T-note yields to 3.94% from 3.83%…
-
SP 500 Approaching Critical Test of March Low
The relentless selling pressure that has transpired since about 3 PM ET yesterday (Wednesday) despite some intense oversold readings and developing momentum divergences has started…
-
Oil Rising, Clean Energy Reversing?
When I look at the daily chart of crude oil, now it appears that a new upleg is in progress with a target of ...…
-
Higher Oil Bullish for Clean Energy? Not Necessarily!
One would think that if crude oil were about to spike to $150/bbl or higher, that the "clean energy" portfolio, otherwise known as solar stocks,…
-
SP in Developing Bullish Pattern, While Oil Still Refuses to Rest
Thursday morning I posted a weekly S&P 500 chart for subscribers noting: "Although we still have two trading days remaining this week, a very interesting…
-
Near-term Top in the Euro/Dollar, Bottom in SP 500?
Two very significant technical breakouts could be approaching at the moment that will confirm a near-term top in the Euro/Dollar and an intermediate-term bottom in…
-
Gold Highs, Dollar Lows Not for Long
There is a fascinating technical situation in the euro-$ vs. the pattern exhibited by spot gold prices. All of the action in the euro from…
-
Technical Set-ups Promising
The Q's emerged from a three-week base formation today, breaking above key near-term resistance at 43.40/50, and then following through to attack the next important…
-
Forward Thinking for the Markets
I am not the only market-watcher who has noticed that although the news seems to get progressively worse for the banks and brokers, and stress…
-
Commodities Sell Off, Though Natural Gas Bucks Trend
Oil, gold, and the agricultural commodities are experiencing some serious selling pressure for a change, as reflected by the charts through Tuesday. First let's have…
-
Could Gold Mimic Platinum's Move?
My technical work is telling me (and has been telling me) that gold prices (the GLD) is on borrowed time on the upside, and that…
-
Countertrend Rally Has Higher to Climb
Here is a look at the two scenarios for the SPY -- the S&P 500 ETF. My preferred count calls for a climb towards 140…
-
Short-term Upside in SP500 and NDX
This week we're looking at some short-term patterns for trading this volatile market, starting with the hourly chart on the S&P 500 Depository Receipts (SPY),…
-
Dominant Trend Remains Down
In the end, investors and traders really did not want to go home long equities Friday, even after the Fed's emergency rate cut on Tuesday,…
-
Buyers Will Prevail
Tuesday morning ahead of the open, Citigroup (C) reports earnings, which needless to say, could be problematic for the company, the financial sector, and for…
-
No Bottom Yet...According to Intermediate Charts
A relatively impressive recovery rally during the final 30 minutes of trading, or was it? In fact, based on the pattern carved-out by the Q's,…
-
Long-Term Bull Trend Still Intact
This is a very interesting and important chart right about now. Let's take a closer look?and what we see is that this week's action (so…
-
Shorting Overbought Commodities
The big picture of the DUG (the ProShares UltraShort Oil & Gas ETF) shows Monday morning's huge upside opening gap and follow-through that amounts to…
-
Roaring Into the Top
Thinking outloud: Frankly, a sharply falling dollar coupled with sharply rising (historic) oil prices amidst credit and housing crises would not be considered my ideal…
-
Equities Topping but Oil has Further to Gush
So far, Thursday's plunge in the Nasdaq, as gauged by the QQQQ's, represents only a "minor" pullback within the dominant August-Ocotber uptrend -- unless, of…


