 |
Gold •583 days | 2,368.70 | +35.30 | +1.51% |
 |
Platinum •15 mins | 2,099.40 | +28.80 | +1.39% |
 |
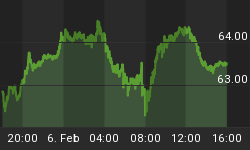
WTI Crude •17 hours | 63.55 | +0.26 | +0.41% |
 |
Gasoline •17 hours | 1.953 | +0.027 | +1.38% |
 |
Ethanol •583 days | 2.161 | +0.000 | +0.00% |
 |
Silver •583 days | 30.82 | +1.16 | +3.92% |
 |
Silver • 583 days | 30.82 | +1.16 | +3.92% | |
 |
Copper • 583 days | 4.530 | +0.111 | +2.51% | |
 |
Brent Crude • 16 hours | 68.05 | +0.50 | +0.74% | |
 |
Natural Gas • 17 hours | 3.422 | -0.087 | -2.48% | |
 |
Heating Oil • 17 hours | 2.413 | +0.020 | +0.84% |

Guy Lerner
Contributor since: 26 Feb 2010
Biography
Guy M. Lerner is the editor and founder of The Technical Take blog.
-
Where the Rubber Meets the Road
There you have it. With today's gap up open, the market will be overbought. In 9 trading days, the market has gone from oversold to…
-
Investor Sentiment: Little has Been Resolved
Last week, the battle lines were drawn, and after much (and expected I might add) volatility this week, little has been resolved. The "dumb money"…
-
Call This a Warning Sign
This is the first real technical warning sign that the market is on the verge of breaking down and the economy is on the verge…
-
Crude Oil Model: Likely Sell Signal
In all likelihood, my crude oil model will generate a sell signal at the close of this month. The signal will in all likelihood will…
-
Market Musings: Fed to the Rescue?
Listening to CNBC there is no question there is much hope placed in the powers of the Federal Reserve. Somehow their initiatives can fix the…
-
Gold Miners Look Attractive
Figure 1 is a weekly chart of the Market Vectors Gold Miners ETF (symbol: GDX). The black and pink dots represent key pivot points, which…
-
The Ultimate in Investor Sentiment
Figure 1 is a weekly chart of the SP500. The indicator in the lower panel is a composite of the "dumb money", Rydex asset data,…
-
Investor Sentiment: Battle Lines are Drawn
The battle lines are clearly drawn. On the one side, investors have turned bearish citing the usual (and real, I might add) factors including but…
-
Is All the Angst Warranted?
Turn on CNBC. Read the headlines. You would think we are already in a bear market having lost 20% or more from the highs in…
-
What Do the Numbers Say?
It is rare for me to make a statement regarding the markets unless I have some data to back me up. In the weekly sentiment…
-
Buying Opportunity or More Selling to Come?
The oversold market is at one of those junctures where investors are certainly scratching their heads. The market is oversold; this is pretty clear. But…
-
Investor Sentiment: Haven't Seen This in a While
For the first time since September 10, 2010, the "dumb money" indicator has turned bearish. The Rydex market timers continue to remain extremely bullish, and…
-
The 3 Stages of a Market Sell-Off
Call this article "the 3 stages of a market sell - off" or more realistically, how the bulls view the market. This is stage 1.…
-
Old School TA - It's Working
We knew it was only a matter of time, but old school technical analysis - like looking at volume - is working. One of the…
-
Treasury Bonds -- 'Critical'
I read a recent article stating that US Treasury bonds were at a critical, technical juncture. I don't know if anything in the markets is…
-
Oversold Market on Edge
It's the Wall Street knee jerk reaction. The market gets oversold and buyers come in and the market bounces higher. It is really quite simple…
-
Dollar Index: Hanging in There
The Dollar Index is making a stand but that is about the most constructive I can get. Figure1 is a weekly chart of the Dollar…
-
Support and Resistance Levels: SPY and QQQ
Figure 1 is a weekly chart of the S&P Depository Receipts (symbol: SPY). The red and black dots are key pivot points, which is a…
-
Investor Sentiment: Sentiment Leads Price
Current market sentiment remains neutral to bullish. The "dumb money" indicator is neutral while the Rydex market timers remain overly bullish (and this is bearish).…
-
Investor Sentiment: The Market Lacks Umph!!
It is becoming clearer by the week that the rally that was ignited last August on the heels of QE2 is running out of gas.…


